Get Chart PowerPoint Presentation Template Designs

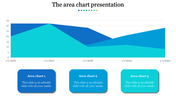
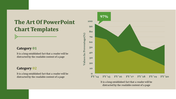
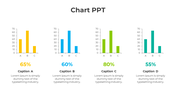

Chart Presentation Template
Transform Your Data into Captivating Narratives with Our Chart PowerPoint Template. Our featured template encapsulates this vision perfectly. Let’s dive into its key features:
Area Chart with Gradient Fills
- The area chart on the left elegantly visualizes trends over time. Each colored section represents a different data series, making it easy to track changes.
- The gradient fills add depth and sophistication, ensuring your data stands out.
- Comparative Insights with Bar Graphs
- On the right, you’ll find horizontal bar graphs comparing percentages associated with Google+, Facebook, and Twitter.
- These side-by-side comparisons allow your audience to grasp key insights instantly.
Whether you’re a seasoned professional, a student, or anyone seeking impactful presentations, our templates are designed for you.
Ease of Use
No advanced design skills are required! Simply input your data, and watch it transform into a visual masterpiece.
Don’t let important data get lost in translation. Download our chart PPT templates today and turn your next presentation into an unforgettable journey.
Features of the template:
- Slides are available in 4:3 & 16:9
- Well-crafted template with instant download.
- Get slides that are 100% customizable and easy to download


You May Also Like These PowerPoint Templates
Add to Wishlist
Download
Edit

Add to Wishlist
Download
Edit

Add to Wishlist
Download
Edit

Add to Wishlist
Download
Edit

Add to Wishlist
Download
Edit

Add to Wishlist
Download
Edit

Add to Wishlist
Download
Edit

Add to Wishlist
Download
Edit

Add to Wishlist
Download
Edit

Add to Wishlist
Download
Edit


Add to Wishlist
Download
Edit

Add to Wishlist
Download
Edit

Add to Wishlist
Download
Edit

Add to Wishlist
Download
Edit

Add to Wishlist
Download
Edit

Add to Wishlist
Download
Edit

Add to Wishlist
Download
Edit

Add to Wishlist
Download
Edit

Add to Wishlist
Download
Edit
