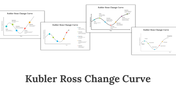
Perceptual Map Template for Any Data-Heavy Presentation

Perceptual map slide showcasing product placement across geographical regions Europe, Asia, and Africa in colored boxes.
P.ID : 59908
    320 views
    18 Downloads
    Get Custom Slides by Experts
    Enhance Your Presentations with Add-ins
    Google Slides Add-in
    Access templates directly in Google Slides
    Microsoft PowerPoint Add-in
    Access templates directly in PowerPoint
    GPT Add-on
    AI-powered presentation assistance

    Perceptual Map Template — PowerPoint, Google Slides, and Canva Template


    Data-heavy slides lose the room. Infographic layouts turn complex information into visuals your audience absorbs instantly — without reading a word.


    This Perceptual Map Template gives you a clean, fully editable presentation slide that's ready to use the moment you download it. The slide features perceptual map slide showcasing product placement across geographical regions Europe, Asia, and Africa in colored boxes. Drop it into your deck, replace the placeholder text, and you're done.


    What's Inside


    A focused single-slide design — built for one strong visual message, fast to customize — text, colors, icons, and layout are all yours to adjust. Design variations include: Perceptual Map, Perceptual Maps, Perceptual Mapping, Perceptual Map Marketing Example. Match your brand, adapt the layout, change the colors — it takes minutes, not hours.


    Who This Is For


    Built for marketers, analysts, consultants, and educators who need to communicate complex data or multi-step processes visually. No design background needed — just open, edit, and present.


    Formats & Download


    Available for PowerPoint, Google Slides, and Canva. Download instantly — no design skills required. Everything is fully customizable to match your brand or topic.


    Key Features


    • Fully editable — text, colors, icons, and layout
    • Compatible with PowerPoint, Google Slides, and Canva
    • 16:9 widescreen format — presentation-ready
    • Clean, professional design — no clutter
    • Premium — instant download access

    Explore more Chart infographics slides to find the right fit for your next presentation.


    Related collections: Process PowerPoint templates | Timeline slide templates

    Advertisement

    You May Also Like These PowerPoint Templates

    Add to Wishlist
    Download
    AI Customize
    Kano model with a red arrow and orange, red, and green zones for user satisfaction placed in a white background.
    Add to Wishlist
    Download
    AI Customize
    Circular segmented graph showing percentages from 52% to 80% in green and blue tones, with text captions on the right.
    Add to Wishlist
    Download
    AI Customize
    Graph illustrating the Endowment Effect, showing value versus outcome with gains and losses marked.
    Add to Wishlist
    Download
    AI Customize
    Graphics PowerPoint slide featuring five vertical progress bars with different percentages and icons with captions.
    Add to Wishlist
    Download
    AI Customize
    Story plot diagram with beginning, middle, and end sections in pastel colors, connected by icons on a line graph.
    Add to Wishlist
    Download
    AI Customize
    Graph illustrating the yearly findings of how to find PowerPoint templates from 2016 to 2023 with two data series.
    Free
    Add to Wishlist
    Download
    AI Customize
    Slide with green radar chart, satellite dish on the right, and two labeled statistical hexagonal sections below.
    Add to Wishlist
    Download
    AI Customize
    Line graph representing the Kubler Ross Model with seven emotional stages marked by colored points on a curve.
    Add to Wishlist
    Download
    AI Customize
    PowerPoint slide showing a quick fact about music's impact, with a graph displaying intelligence levels and famous composers.
    Free
    Add to Wishlist
    Download
    AI Customize
    Slide with a sloping bar graph in green and gray segments, three numbered points, and a text box on the right.
    Add to Wishlist
    Download
    AI Customize
    Slide showing a graph of the Dunning-Kruger Effect with stages from knowing nothing to becoming an expert with a title text.
    Add to Wishlist
    Download
    AI Customize
    Narrative arc slide displaying key plot stages with placeholder text areas.
    Add to Wishlist
    Download
    AI Customize
    Line graph slide with two data series in red and yellow, showing item based data fluctuations and a text caption.
    Add to Wishlist
    Download
    AI Customize
    Graph showing an upward curve with captions along key points, indicating growth or improvement over time.
    Add to Wishlist
    Download
    AI Customize
    A curve graph with two lines in teal and black and six labeled points, with corresponding captions on the right.
    Add to Wishlist
    Download
    AI Customize
    A collection of story arc slides featuring graphs illustrating rising action, climax, and resolution points for storytelling.
    Add to Wishlist
    Download
    AI Customize
    An S shaped curve graph with three key points, illustrating growth or change over time with captions.