Learn How To Make A Graph In PowerPoint Slide


How To Make A Graph In PowerPoint?
Are you ready to create an excellent graph PowerPoint template?. Then let's start. SlideEgg provides a bundle of templates explaining How To Make A Graph In PowerPoint with floral designs.
Use these straightforward procedures to add graph designs to slides to create a professional presentation. Go through these steps to make your procedure easy and flexible.
How To Make A Graph In PowerPoint?
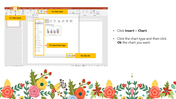
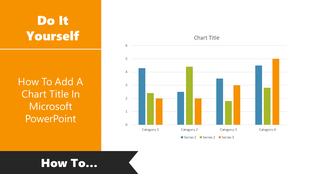
Step 1: Open PowerPoint and select insert. Now select the chart and make the chart type choice. Now click ok.
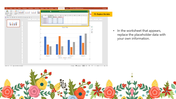
Step 2: Select the data to be replaced.
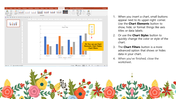
Step 3: Make the chance with the additional features. Click ok.
Other steps make this process simple. You can download edited templates from SlideEgg and make your presentation a success.




You May Also Like These PowerPoint Templates































Showing36 of69,218 templates