Guide: How To Add A Chart Title In Microsoft PowerPoint


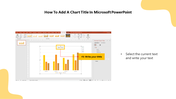

Steps to Add a Chart Title in Presentation
When you want your audience to grasp many facts and the connections among the data quickly, use a chart. A chart frequently outperforms a table of difficult-to-read numbers when displaying information graphically. You can use a chart to communicate your data visually.
How to Add a Chart Title in PowerPoint?
If you need to add a title to a PowerPoint chart using Microsoft PowerPoint, here are a few quick tips that can help you.
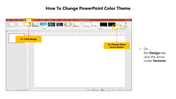
Step 1 : Select the Insert tab.
Step 2 : Click the Insert Chart command in the Illustrations Group. The Insert Chart dialog box will appear.
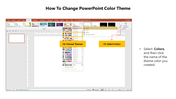
Step 3 : Select a category from the dialog box's left pane, and review the charts in the center.
Step 4 : Select the desired chart.
Step 5 : Click OK. An Excel window will open with a placeholder for your data.
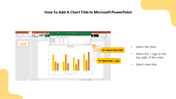
That’s it! Charts in PowerPoint make it considerably simpler to demonstrate comparisons and trends while allowing your audience to understand the significance of the numbers.
You will learn how to insert charts and adjust them in this session so that they effectively convey information. Following these simple instructions will make your process as easy as ABC.
Visit SlideEgg and make your PowerPoint creation easy with all the pre-designed slides available in our deck. The best ones are a stone's throw away! Come on and use all our slides to your fullest!

You May Also Like These PowerPoint Templates

Add to Wishlist
Download
AI Customize

Free
Add to Wishlist
Download
AI Customize

Add to Wishlist
Download
AI Customize


Add to Wishlist
Download
AI Customize

Add to Wishlist
Download
AI Customize

Add to Wishlist
Download
AI Customize

Add to Wishlist
Download
AI Customize


Free
Add to Wishlist
Download
AI Customize

Free
Add to Wishlist
Download
AI Customize

Add to Wishlist
Download
AI Customize

Add to Wishlist
Download
AI Customize


Free
Add to Wishlist
Download
AI Customize


Add to Wishlist
Download
AI Customize


Add to Wishlist
Download
AI Customize

Free
Add to Wishlist
Download
AI Customize

Free
Add to Wishlist
Download
AI Customize

Add to Wishlist
Download
AI Customize


Add to Wishlist
Download
AI Customize

Add to Wishlist
Download
AI Customize

Add to Wishlist
Download
AI Customize

Add to Wishlist
Download
AI Customize


Add to Wishlist
Download
AI Customize

Add to Wishlist
Download
AI Customize

Add to Wishlist
Download
AI Customize

Add to Wishlist
Download
AI Customize

Add to Wishlist
Download
AI Customize
