Free - Free Morocco PPT Presentation Templates and Google Slides

Free
Gray world map with a blue dot, followed by three vertically aligned text boxes in blue, red, and green.
P.ID : 53811
    1K+ views
    159 Downloads
    Get Custom Slides by Experts
    Instantly Access Templates in PowerPoint

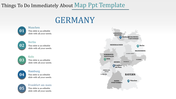
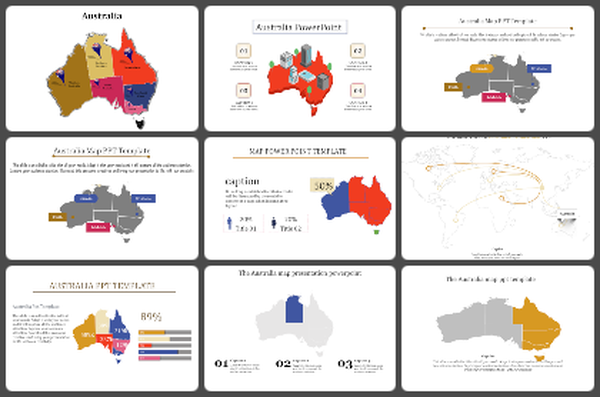
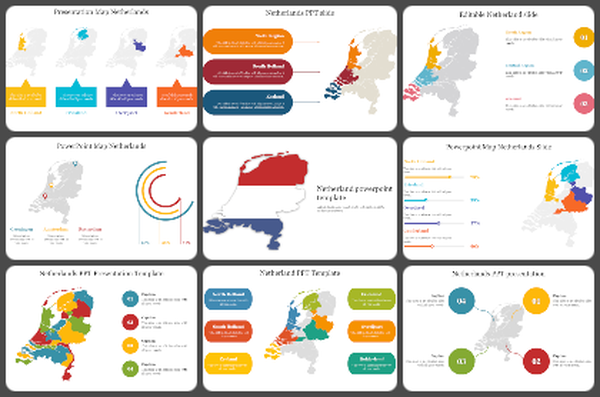
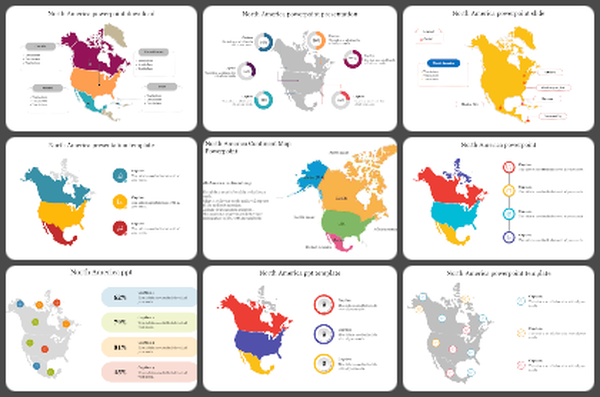
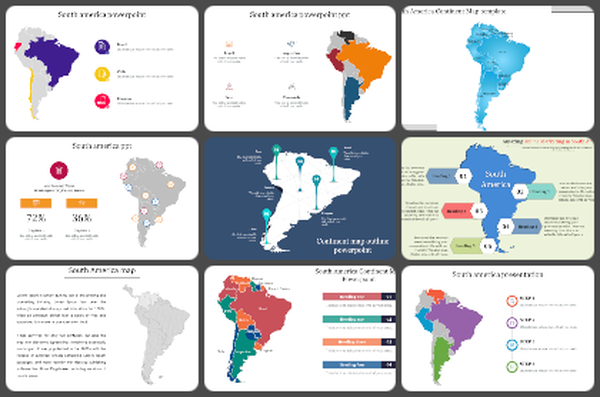
    Morocco Map Presentation slide

    Morocco is a country located in North Africa, bordered by the Atlantic Ocean and the Mediterranean Sea. Its capital city is Rabat, and the largest city is Casablanca. Morocco has a rich history, culture, and traditions, influenced by its indigenous Berber, Arab, and European heritage. The country is known for its diverse landscapes, including the Sahara Desert, the Atlas Mountains, and coastal beaches, as well as its famous cuisine, handicrafts, and music. A Morocco template is versatile and can be used to create visually appealing content about Morocco, including presentations, travel guides, marketing materials, and educational materials. It can include images of famous landmarks, traditional clothing, local cuisine, and more. This template can provide valuable information about the country's history, culture, geography, politics, and tourism. It is used as both Powerpoint and Google slide

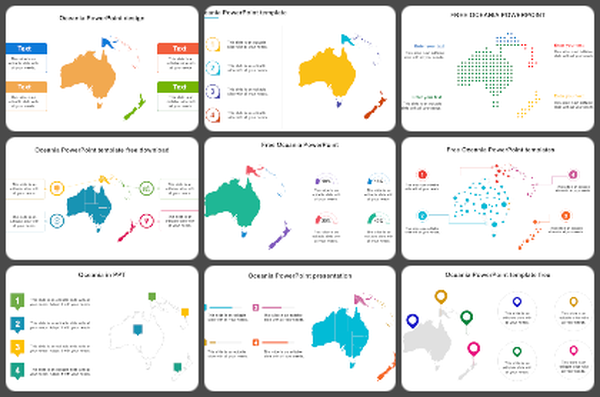
    Features Of The Template:

    • 100% customizable slide and easy to download
    • The slides contained 16:9 and 4:3 format..
    • Well-crafted Template with instant download facility.
    • Crisp and elegant font style. 
    • The best Template with attractive nodes
    Advertisement

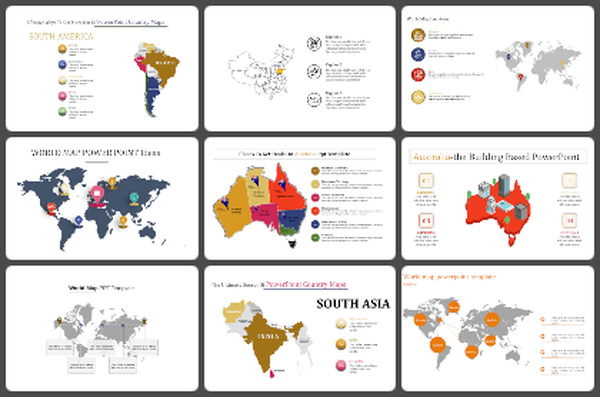
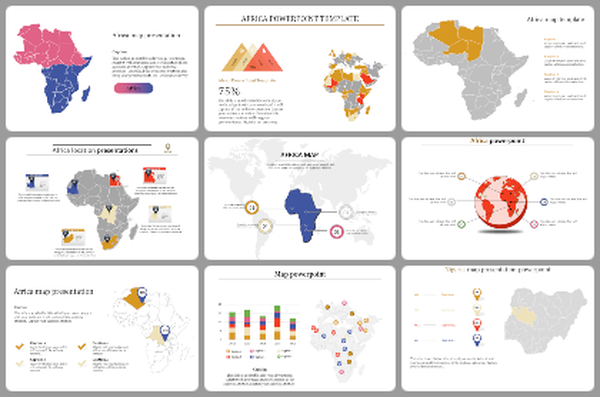
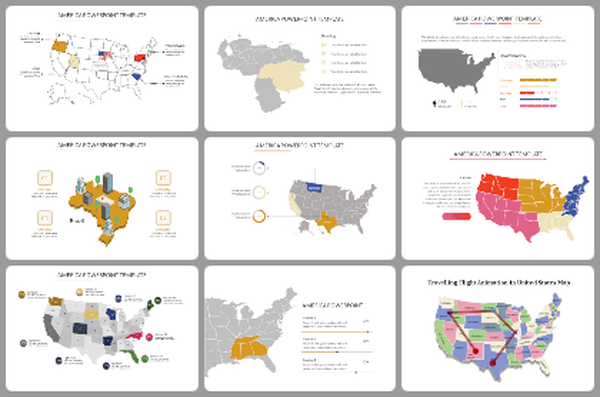
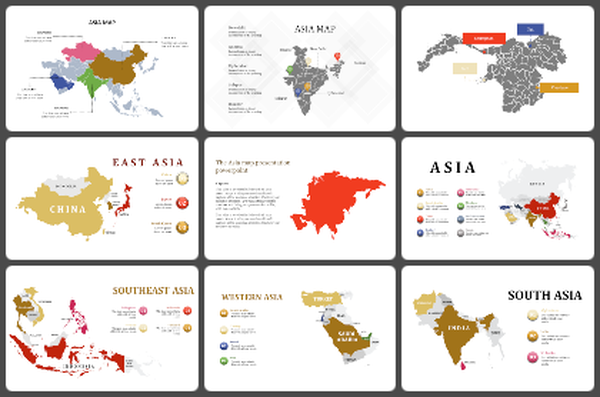
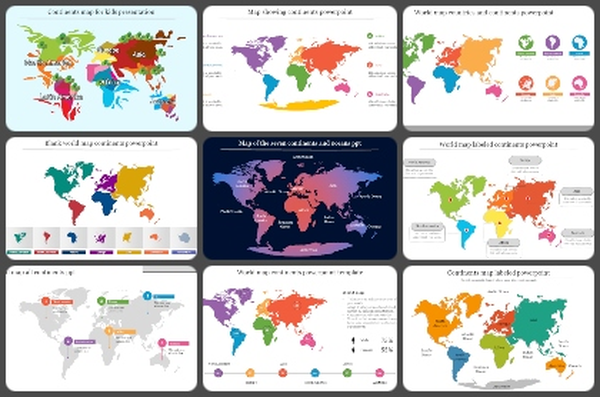
    You May Also Like These PowerPoint Templates

    Free
    Add to Wishlist
    Download
    AI Customize
    Africa map outline with four numbered markers in pink, blue, purple, and maroon, connected to placeholder text areas.
    Add to Wishlist
    Download
    AI Customize
    Map of Europe with three colorful target markers and placeholder text areas placed in a white backdrop.
    Free
    Add to Wishlist
    Download
    AI Customize
    Africa map PowerPoint template with distinct sections highlighted, each with space for text.
    Add to Wishlist
    Download
    AI Customize
    Gray Africa map with purple, green, blue, orange, and red markers and text sections on both sides.
    Add to Wishlist
    Download
    AI Customize
    Global map visualization showing numbered country markers for Canada, Brazil, Denmark, Africa, Russia, and Australia.
    Add to Wishlist
    Download
    AI Customize
    Asia map in gray with northern regions highlighted in red, and descriptive text on the right.
    Add to Wishlist
    Download
    AI Customize
    Color coded map of Japan with regions highlighted in yellow, pink, and blue alongside descriptive captions.
    Add to Wishlist
    Download
    AI Customize
    Gray USA map highlighting states in blue and green, with text sections and circular graphs below.
    Add to Wishlist
    Download
    AI Customize
    Global map featuring five countries in red, blue, green, orange, and purple, with text boxes linked to each.
    Add to Wishlist
    Download
    AI Customize
    Circular chart with percentages surrounding a map of Indonesia in the center, with sections in various colors.
    Add to Wishlist
    Download
    AI Customize
    Asia map slide with transport icons including airplane, bus, car, train, and boat for different regions.
    Add to Wishlist
    Download
    AI Customize
    World map slide highlighting different regions with percentage markers, showcasing various data points across continents.
    Add to Wishlist
    Download
    AI Customize
    PowerPoint slides showcasing a map of the USA with regional color coding and infographics.
    Add to Wishlist
    Download
    AI Customize
    Gray world map with color highlights for USA, Russia, Brazil, and Australia, alongside a bar chart showing data percentages.
    Add to Wishlist
    Download
    AI Customize
    Gray world map with five percentage data points in colored boxes over various continents, displaying statistical values.
    Add to Wishlist
    Download
    AI Customize
    Map with data points in colored circles, left side includes a text area and data infographic.