Slidea Logo
Try it now — the new, easy way to turn your slides into an interactive experience.
Explore Now

Executive Project Dashboard PowerPoint and Google Slides

Color coded executive dashboard slide displaying a timeline of tasks, various sections, and charts.
P.ID : 3935
    4.2K+ views
    384 Downloads
    Get Custom Slides by Experts
    Enhance Your Presentations with Add-ins
    Google Slides Add-in
    Access templates directly in Google Slides
    Microsoft PowerPoint Add-in
    Access templates directly in PowerPoint
    GPT Add-on
    AI-powered presentation assistance

    Executive Dashboard Ppt — PowerPoint and Google Slides Template

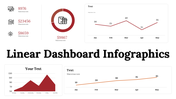
    Dashboards packed with raw numbers lose the room. A structured visual layout guides attention to the metrics that matter — and makes decisions easier.

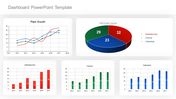
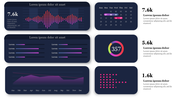
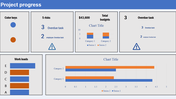
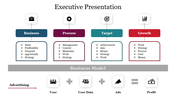
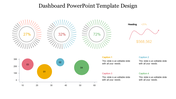
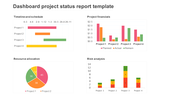
    This executive dashboard ppt gives you a clean, fully editable presentation slide that's ready to use the moment you download it. The slide features color coded executive dashboard slide displaying a timeline of tasks, various sections, and charts. Drop it into your deck, replace the placeholder text, and you're done.

    What's Inside

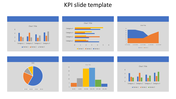
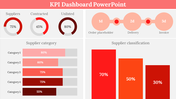
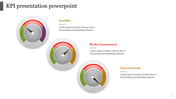
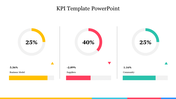
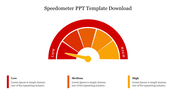
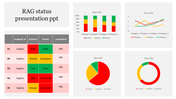
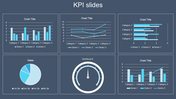
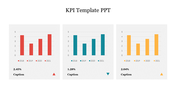
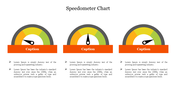
    A focused single-slide design — built for one strong visual message, fast to customize — text, colors, icons, and layout are all yours to adjust. Design variations include: Executive, KPI, KPI Dashboard, Dashboard. Match your brand, adapt the layout, change the colors — it takes minutes, not hours.

    Who This Is For

    Built for analysts, business intelligence teams, executives, and managers presenting performance data in a clear, visual format. No design background needed — just open, edit, and present.

    Formats & Download

    Available for PowerPoint and Google Slides. Download instantly — no design skills required. Everything is fully customizable to match your brand or topic.

    Key Features

    • Fully editable — text, colors, icons, and layout
    • Compatible with PowerPoint and Google Slides
    • 16:9 widescreen format — presentation-ready
    • Clean, professional design — no clutter
    • Premium — instant download access

    Explore more Dashboard slides to find the right fit for your next presentation.

    Related collections: Market analysis templates | Business plan templates

    Advertisement

    You May Also Like These PowerPoint Templates

    Add to Wishlist
    Download
    AI Customize
    Three semi circle gauges in pastel colors, with percentage labels above, and related text and icons beneath.
    Add to Wishlist
    Download
    AI Customize
    Three speedometers showing progress percentages: 25%, 50%, and 75%, with gradient colors in yellow, orange, and red.
    Free
    Add to Wishlist
    Download
    AI Customize
    Slide with three gauge meters in orange, yellow, and gray, each paired with a table for KPI metrics.
    Free
    Add to Wishlist
    Download
    AI Customize
    KPI presentation template displaying colorful charts for revenue, units sold, and product category analysis.
    Free
    Add to Wishlist
    Download
    AI Customize
    Effective Project Dashboard PowerPoint Presentation
    Add to Wishlist
    Download
    AI Customize
    Speedometer clipart slide featuring three gauges at 25%, 50%, and 75% with space for descriptive text below each.
    Free
    Add to Wishlist
    Download
    AI Customize
    KPI slide displaying key performance indicators with many sections and accompanying data charts.
    Add to Wishlist
    Download
    AI Customize
    Slide deck on developing Executive Presence with topics in different colorful layout designs with icons.
    Add to Wishlist
    Download
    AI Customize
    Dashboard slide showcasing project management KPIs with bar graphs, a line graph, and a pie chart in different colors.
    Add to Wishlist
    Download
    AI Customize
    Project management dashboard with charts for budget, progress, risks, workload, and projected launch date and icons.
    Add to Wishlist
    Download
    AI Customize
    PowerPoint slide with KPI dashboard metrics, including revenue, sales by month, and customer revenue comparison.
    Free
    Add to Wishlist
    Download
    AI Customize
    KPI Dashboard with bubbles for sales, attendance, download, and report and a client location legend.
    Add to Wishlist
    Download
    AI Customize
    KPI Training slide featuring a social media analysis table with metrics for followers, mentions, interactions, and shares.
    Add to Wishlist
    Download
    AI Customize
    Task management dashboard slide showing task numbers and completion percentages with colored gauge icons.
    Add to Wishlist
    Download
    AI Customize
    Revenue dashboard with bar charts, statistics, and sliders showing data metrics in various colors.
    Add to Wishlist
    Download
    AI Customize
    Editable Speedometer PowerPoint Template Presentation
    Add to Wishlist
    Download
    AI Customize
    KPI slide highlighting essential business metrics alongside color coded sections for quick reference and analysis.