Get Creative Dashboard PPT Presentation Template Slides


Customizable Dashboard PowerPoint Template
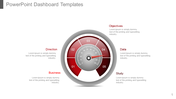
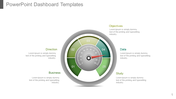
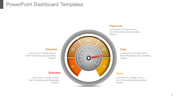
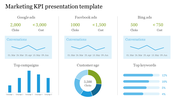
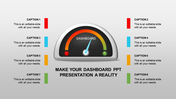
Introducing Our Dashboard Speedometer Design PowerPoint Template is ideal for highlighting key performance indicators (KPIs) or for making quick comparisons between different datasets. You can easily customize the text, colors, and charts to match your specific brand and data. This template is tailored for Business professionals: Boost your sales pitches, quarterly reports, or client presentations with impactful data visualization. Educators Transform complex concepts into engaging visuals that resonate with their students. Students: Effectively present research findings or project results with a professional touch. Save time and effort while creating stunning presentations with our Dashboard PowerPoint Template. Easy to use: No design experience required! Simply replace the placeholder text and data with your information. Visually appealing: Pre-designed layouts and charts ensure your data looks polished and professional. Download our Templates and Google Slides Themes.
Features of the template:
- Slides are available in 4:3 & 16:9
- Well-crafted template with instant download.
- Get slides that are 100% customizable and easy to download


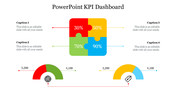
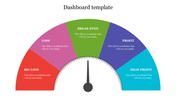
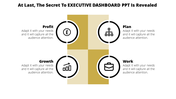
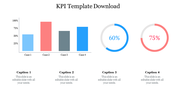
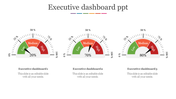
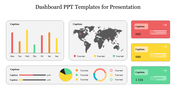
You May Also Like These PowerPoint Templates
Add to Wishlist
Download
Edit


Add to Wishlist
Download
Edit

Add to Wishlist
Download
Edit

Add to Wishlist
Download
Edit

Add to Wishlist
Download
Edit

Add to Wishlist
Download
Edit


Add to Wishlist
Download
Edit


Add to Wishlist
Download
Edit

Add to Wishlist
Download
Edit


Add to Wishlist
Download
Edit

Add to Wishlist
Download
Edit

Add to Wishlist
Download
Edit

Add to Wishlist
Download
Edit


Add to Wishlist
Download
Edit

Add to Wishlist
Download
Edit
