Big Data Infographics PowerPoint And Google Slides Themes

Pack of 36 slides
P.ID : 69543
Advertisement
746 views
174 Downloads
Get Custom Slides by Experts
Instantly Access Templates in PowerPoint

Big data Infographic Bundle Of PowerPoint templates

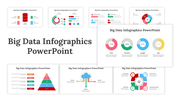
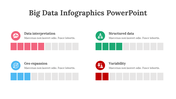
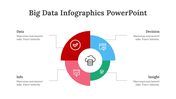
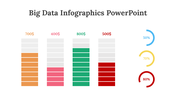
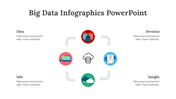
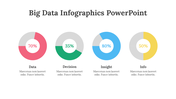
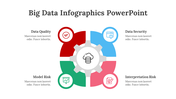
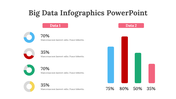
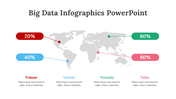
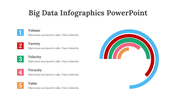
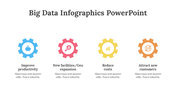
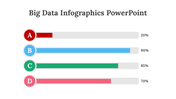
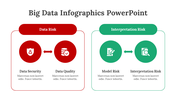
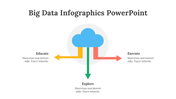
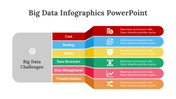
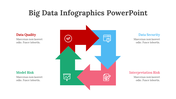
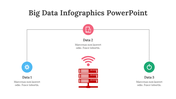
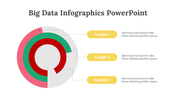
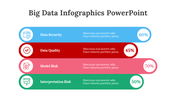
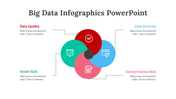
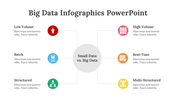
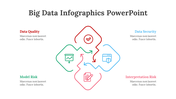
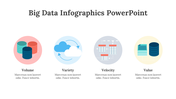
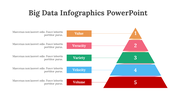
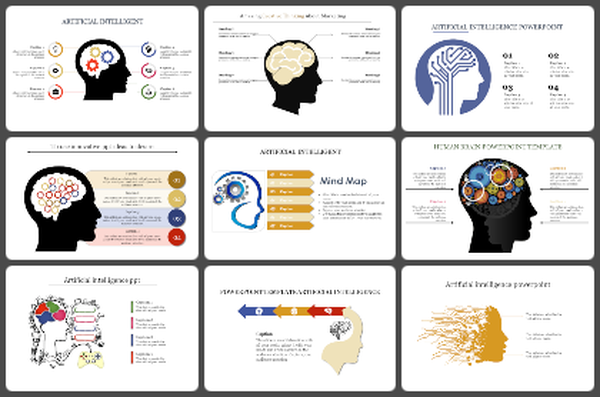
Using the Big Data Infographics PowerPoint template pack is a terrific method to quickly and attractively convey facts and information. This template package comes with 36 slides as well as a number of useful icons, shapes, and maps for presentations. You may quickly alter the color scheme, fonts, and other design aspects on the slides to suit your needs because they are entirely editable. A range of graphs, charts, and diagrams are also included with the template, which can be used to clearly and concisely illustrate data and patterns. You'll have everything you need with this package to put together a strong, polished presentation.

Features of the Template

  • 100% customizable slides and easy to download.
  • Slides are available in different colors
  • The slide has 4:3 and 16:9 formats.
  • Easy to change the slide colors quickly.
  • Appealing Presentation to impress an audience.
  • Create feature-rich slide presentations. 
  • An eye-pleasing color slide helps to give a catchy display.
  • Trendy design of data information template bundle.

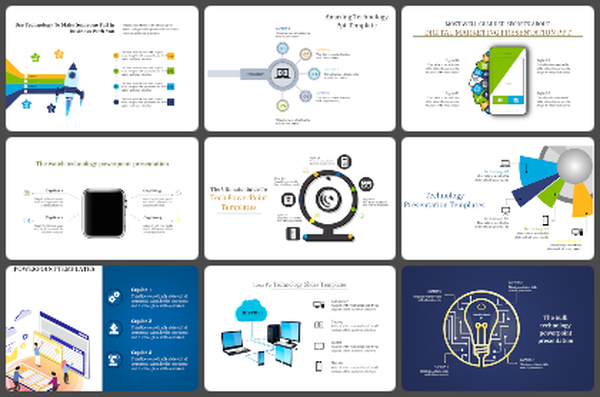
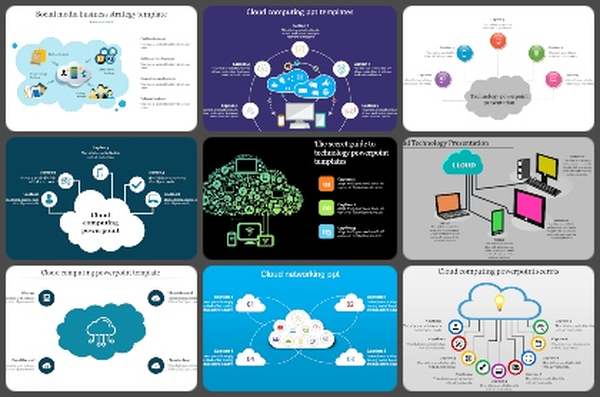
You May Also Like These PowerPoint Templates

Free
Add to Wishlist
Download
AI Customize
A circular chart with orange and purple segments surrounding a central star, with relevant icons and numbered text.
Add to Wishlist
Download
AI Customize
Slide with a yellow theme, showing a server at the top linked to five pie charts, each labeled with captions.
Add to Wishlist
Download
AI Customize
Slide design featuring a laptop and data storage graphics for big data analysis, listing various categories with text.
Add to Wishlist
Download
AI Customize
Best PowerPoint Templates Data Visualization
Add to Wishlist
Download
AI Customize
DBMS diagram showing a local database, request and reply process, an application interacting with the DBMS, and an end user.
Free
Add to Wishlist
Download
AI Customize
Colorful Venn diagram infographic illustrating key components of Big Data with associated methods and icons.
Add to Wishlist
Download
AI Customize
Slide deck with a dark theme, featuring a glowing network sphere and blue highlights, about big data concepts.
Add to Wishlist
Download
AI Customize
Infographic with six colorful blocks connected to a central grey column, listing big data advantages.
Add to Wishlist
Download
AI Customize
Data collection template with colored oval labels listing methods such as review records, weighting, case study, and more.
Add to Wishlist
Download
AI Customize
Illustration of a database and servers in a yellow box, with four numbered points placed around it.
Add to Wishlist
Download
AI Customize
Illustration of three data servers with colored panels, and numbered caption boxes on the right, on a blue background.
Add to Wishlist
Download
AI Customize
Illustration of women with large data visualizations on the left and placeholder text explaining the benefits.
Add to Wishlist
Download
AI Customize
Database PowerPoint Template For Presentation
Add to Wishlist
Download
AI Customize
Server illustration at the top, linked to four green pie charts below, showing varying percentages and captions.
Add to Wishlist
Download
AI Customize
A radial diagram in multiple colors displaying ten segments, each labeled with a different aspect of big data.
Add to Wishlist
Download
AI Customize
Data center slide with server icon above three pie charts labeled with captions below.
Add to Wishlist
Download
AI Customize
3D layered data visualization with business people interacting, laptops on top, and numbered text sections on the side.
Add to Wishlist
Download
AI Customize
Big data analytics slide deck with colorful charts, showcasing types, benefits, and decision making aids.
Add to Wishlist
Download
AI Customize
Infographic illustrating the four key dimensions of Big Data with associated definitions and icons.
Add to Wishlist
Download
AI Customize
Big data architecture diagram showing a flow from data ingestion, staging, and access to insights, with components.
Free
Add to Wishlist
Download
AI Customize
Three stacked cylinder diagrams in green and purple, connected by arrows to a central circle, set against a gray background.
Add to Wishlist
Download
AI Customize
Big data-related slide with four icons and progress bars on the left, and a percentage-based bar graph on the right.
Add to Wishlist
Download
AI Customize
Three teal outlined rectangular boxes featuring data visualization illustations in blue theme and bullet points below.
Add to Wishlist
Download
AI Customize
A teal server icon at the top with yellow and pink details, connected to three pie charts labeled below.
Add to Wishlist
Download
AI Customize
Folder icon with a magnifying glass on the left, alongside four numbered circles with descriptions in a beige theme.
Add to Wishlist
Download
AI Customize
Isometric illustration of data servers, a laptop, and businesspeople with text about data visualization on the left.
Add to Wishlist
Download
AI Customize
Infographic layout with four colored gears arranged vertically, each featuring icons and text boxes on a white background.
Add to Wishlist
Download
AI Customize
Big Data slide shows a quadrant with complexity versus business value, highlighting predictive analytics on a dark backdrop.
Add to Wishlist
Download
AI Customize
Big data slide showcasing sectors with healthcare, science, security, and business with adaptation notes with icons.
Add to Wishlist
Download
AI Customize
Dark themed slide with five teal outlined boxes containing icons and descriptions about big data benefits.
Free
Add to Wishlist
Download
AI Customize
Big data layout with connected pathways from data storage to various output applications and platforms.
Add to Wishlist
Download
AI Customize
PowerPoint slide showing a data center graphic with pie charts representing different percentages and captions.