Creative 10Vs Of Big Data PPT And Google Slides Template

10Vs of Big Data diagram PPT slide highlighting key concepts in color coded icons with definitions for each.
P.ID : 71881
    155 views
    19 Downloads
    Get Custom Slides by Experts
    Instantly Access Templates in PowerPoint

    Innovatiove 10Vs Of Big Data Presentation Slide


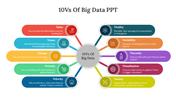
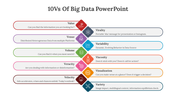
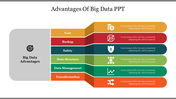
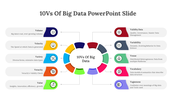
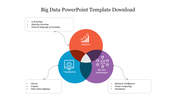
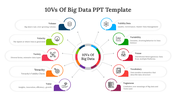
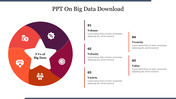
    The 10Vs of big data offer a comprehensive perspective on large datasets, going beyond conventional characteristics to encompass volume, velocity, veracity, value, and vulnerability. This concept caters to data scientists, analysts, and professionals navigating the complexities of big data, guiding them in understanding and optimizing the intricacies of data strategies. The PowerPoint on the 10Vs of big data is a versatile resource designed for clarity, providing visual aids to simplify complex concepts. It serves as an educational tool, encouraging engaging discussions on the evolving landscape of big data. For presenters in the field of data analytics, this template is an invaluable asset, facilitating clear communication and fostering a deeper understanding of big data intricacies.


    Features of thid template:


      • 100% customizable slides and easy to download.
      • Slide are available in different nodes & colors.
      • The slide contains 16:9 and 4:3 formats.
      • Easy to change the colors of the slide quickly.
      • Highly compatible with PowerPoint and Google Slides.
      • Well-crafted template with an instant download facility.
      Advertisement

      You May Also Like These PowerPoint Templates

      Add to Wishlist
      Download
      AI Customize
      Slide deck with a dark theme, featuring a glowing network sphere and blue highlights, about big data concepts.
      Add to Wishlist
      Download
      AI Customize
      Infographic with six colorful blocks connected to a central grey column, listing big data advantages.
      Add to Wishlist
      Download
      AI Customize
      Data collection template with colored oval labels listing methods such as review records, weighting, case study, and more.
      Add to Wishlist
      Download
      AI Customize
      Illustration of a database and servers in a yellow box, with four numbered points placed around it.
      Add to Wishlist
      Download
      AI Customize
      Illustration of three data servers with colored panels, and numbered caption boxes on the right, on a blue background.
      Add to Wishlist
      Download
      AI Customize
      Illustration of women with large data visualizations on the left and placeholder text explaining the benefits.
      Add to Wishlist
      Download
      AI Customize
      Database PowerPoint Template For Presentation
      Add to Wishlist
      Download
      AI Customize
      Data center slide with server icon above three pie charts labeled with captions below.
      Add to Wishlist
      Download
      AI Customize
      3D layered data visualization with business people interacting, laptops on top, and numbered text sections on the side.
      Add to Wishlist
      Download
      AI Customize
      Infographic illustrating the four key dimensions of Big Data with associated definitions and icons.
      Add to Wishlist
      Download
      AI Customize
      Big data architecture diagram showing a flow from data ingestion, staging, and access to insights, with components.
      Free
      Add to Wishlist
      Download
      AI Customize
      Three stacked cylinder diagrams in green and purple, connected by arrows to a central circle, set against a gray background.
      Add to Wishlist
      Download
      AI Customize
      Big data-related slide with four icons and progress bars on the left, and a percentage-based bar graph on the right.
      Add to Wishlist
      Download
      AI Customize
      Three teal outlined rectangular boxes featuring data visualization illustations in blue theme and bullet points below.
      Add to Wishlist
      Download
      AI Customize
      A teal server icon at the top with yellow and pink details, connected to three pie charts labeled below.
      Add to Wishlist
      Download
      AI Customize
      Folder icon with a magnifying glass on the left, alongside four numbered circles with descriptions in a beige theme.
      Add to Wishlist
      Download
      AI Customize
      Isometric illustration of data servers, a laptop, and businesspeople with text about data visualization on the left.
      Add to Wishlist
      Download
      AI Customize
      Big Data slide shows a quadrant with complexity versus business value, highlighting predictive analytics on a dark backdrop.