Editable 10Vs Of Big Data PPT Presentation And Google Slides

Pack of 13 slides
P.ID : 71885
Advertisement
327 views
61 Downloads
Get Custom Slides by Experts
Instantly Access Templates in PowerPoint

Amazing 10Vs Of Big Data Presentation Slides


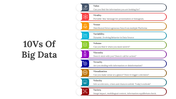
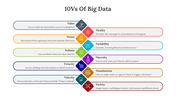
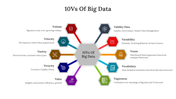
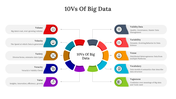
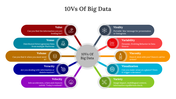
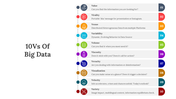
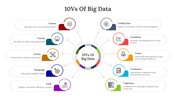
In the realm of data analytics, the 10Vs of big data revolutionize understanding, moving beyond conventional attributes to encompass volume, velocity, veracity, value, and vulnerability. This concept, crucial for data scientists and analysts, navigates the intricacies of vast datasets for informed decision-making. Accompanying this, the PowerPoint becomes an invaluable tool, designed for clarity and accessibility. With visual aids and narrative precision, it simplifies complex concepts for a broad audience. Fully editable to meet diverse presentation needs, the template serves as an educational asset, fostering engagement and highlighting the advantages of comprehending the 10Vs. For presenters, it not only ensures clear communication but also encourages exploration and a deeper understanding of the dynamic world of big data, making it an essential resource for professionals in the field of data analytics.


Features of the templates:


  • 100% customizable slides and easy to download.
  • Slides are available in different nodes & colors.
  • The slide contains 16:9 and 4:3 formats.
  • Easy to change the colors of the slide quickly.
  • Highly compatible with PowerPoint and Google Slides.
  • Well-crafted template with an instant download facility.

You May Also Like These PowerPoint Templates

Free
Add to Wishlist
Download
AI Customize
Big data PowerPoint template with a graphic explaining the four key characteristics of big data with placeholder text.
Free
Add to Wishlist
Download
AI Customize
Big Data PowerPoint Templates and Google Slides
Free
Add to Wishlist
Download
AI Customize
A slide displaying types of big data in three categories, each block containing icons and example data types.
Free
Add to Wishlist
Download
AI Customize
A circular chart with orange and purple segments surrounding a central star, with relevant icons and numbered text.
Add to Wishlist
Download
AI Customize
Slide with a yellow theme, showing a server at the top linked to five pie charts, each labeled with captions.
Add to Wishlist
Download
AI Customize
Slide design featuring a laptop and data storage graphics for big data analysis, listing various categories with text.
Add to Wishlist
Download
AI Customize
Best PowerPoint Templates Data Visualization
Add to Wishlist
Download
AI Customize
DBMS diagram showing a local database, request and reply process, an application interacting with the DBMS, and an end user.
Free
Add to Wishlist
Download
AI Customize
Colorful Venn diagram infographic illustrating key components of Big Data with associated methods and icons.
Add to Wishlist
Download
AI Customize
Slide deck with a dark theme, featuring a glowing network sphere and blue highlights, about big data concepts.
Add to Wishlist
Download
AI Customize
Infographic with six colorful blocks connected to a central grey column, listing big data advantages.
Add to Wishlist
Download
AI Customize
Data collection template with colored oval labels listing methods such as review records, weighting, case study, and more.
Add to Wishlist
Download
AI Customize
Illustration of a database and servers in a yellow box, with four numbered points placed around it.
Add to Wishlist
Download
AI Customize
Illustration of three data servers with colored panels, and numbered caption boxes on the right, on a blue background.
Add to Wishlist
Download
AI Customize
Illustration of women with large data visualizations on the left and placeholder text explaining the benefits.
Add to Wishlist
Download
AI Customize
Database PowerPoint Template For Presentation
Add to Wishlist
Download
AI Customize
Server illustration at the top, linked to four green pie charts below, showing varying percentages and captions.
Add to Wishlist
Download
AI Customize
A radial diagram in multiple colors displaying ten segments, each labeled with a different aspect of big data.
Add to Wishlist
Download
AI Customize
Data center slide with server icon above three pie charts labeled with captions below.
Add to Wishlist
Download
AI Customize
3D layered data visualization with business people interacting, laptops on top, and numbered text sections on the side.
Add to Wishlist
Download
AI Customize
Big data analytics slide deck with colorful charts, showcasing types, benefits, and decision making aids.
Add to Wishlist
Download
AI Customize
Infographic illustrating the four key dimensions of Big Data with associated definitions and icons.
Add to Wishlist
Download
AI Customize
Big data architecture diagram showing a flow from data ingestion, staging, and access to insights, with components.
Free
Add to Wishlist
Download
AI Customize
Three stacked cylinder diagrams in green and purple, connected by arrows to a central circle, set against a gray background.
Add to Wishlist
Download
AI Customize
Big data-related slide with four icons and progress bars on the left, and a percentage-based bar graph on the right.
Add to Wishlist
Download
AI Customize
Three teal outlined rectangular boxes featuring data visualization illustations in blue theme and bullet points below.
Add to Wishlist
Download
AI Customize
A teal server icon at the top with yellow and pink details, connected to three pie charts labeled below.
Add to Wishlist
Download
AI Customize
Folder icon with a magnifying glass on the left, alongside four numbered circles with descriptions in a beige theme.
Add to Wishlist
Download
AI Customize
Isometric illustration of data servers, a laptop, and businesspeople with text about data visualization on the left.
Add to Wishlist
Download
AI Customize
Infographic layout with four colored gears arranged vertically, each featuring icons and text boxes on a white background.
Add to Wishlist
Download
AI Customize
Big Data slide shows a quadrant with complexity versus business value, highlighting predictive analytics on a dark backdrop.
Add to Wishlist
Download
AI Customize
Big data slide showcasing sectors with healthcare, science, security, and business with adaptation notes with icons.