Explore Big Data PowerPoint Presentation And Google Slides

Pack of 18 slides
P.ID : 61869
Advertisement
523 views
70 Downloads
Get Custom Slides by Experts
Enhance Your Presentations with Add-ins
Google Slides Add-in
Access templates directly in Google Slides
Microsoft PowerPoint Add-in
Access templates directly in PowerPoint
GPT Add-on
AI-powered presentation assistance

Big Data PowerPoint, Google Slides, and Canva Template


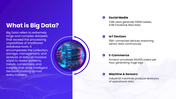
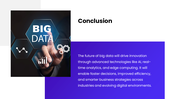
Explain complex technology in a simple way with this Big Data PowerPoint Template! Designed for data analysts, IT professionals, business teams, and students, this modern purple-color-themed template helps you present big data concepts, analytics, and insights clearly and effectively. With fully editable slides and clean layouts, you can easily turn technical data into easy-to-understand visuals for any audience.


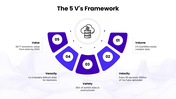
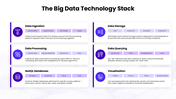
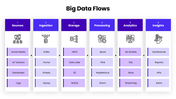
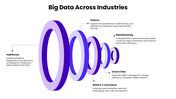
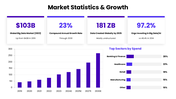
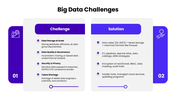
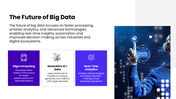
Perfect for tech presentations, business intelligence reports, and academic projects, this template includes slides on big data basics, the 5V framework, data flow, technology stack, industry applications, market growth, challenges, and future trends. The structured design, combined with charts and infographics, makes your content engaging and easy to follow.


Turn your data into smart decisions and powerful stories! Download this Big Data Template today and create professional, high-quality presentations in minutes.


Features of this template

  • 100% customizable slides and easy to download.
  • The slides contain 16:9 and 4:3 formats.
  • Easy to change the colors quickly.
  • Highly compatible with PowerPoint, Google Slides, and Canva templates.

You May Also Like These PowerPoint Templates

Free
Add to Wishlist
Download
AI Customize
Colorful Venn diagram infographic illustrating key components of Big Data with associated methods and icons.
Free
Add to Wishlist
Download
AI Customize
Slide deck with a dark theme, featuring a glowing network sphere and blue highlights, about big data concepts.
Add to Wishlist
Download
AI Customize
Infographic with six colorful blocks connected to a central grey column, listing big data advantages.
Add to Wishlist
Download
AI Customize
Data collection template with colored oval labels listing methods such as review records, weighting, case study, and more.
Add to Wishlist
Download
AI Customize
Illustration of a database and servers in a yellow box, with four numbered points placed around it.
Add to Wishlist
Download
AI Customize
Illustration of three data servers with colored panels, and numbered caption boxes on the right, on a blue background.
Add to Wishlist
Download
AI Customize
Illustration of women with large data visualizations on the left and placeholder text explaining the benefits.
Add to Wishlist
Download
AI Customize
Database PowerPoint Template For Presentation
Add to Wishlist
Download
AI Customize
Server illustration at the top, linked to four green pie charts below, showing varying percentages and captions.
Add to Wishlist
Download
AI Customize
A radial diagram in multiple colors displaying ten segments, each labeled with a different aspect of big data.
Add to Wishlist
Download
AI Customize
Data center slide with server icon above three pie charts labeled with captions below.
Add to Wishlist
Download
AI Customize
3D layered data visualization with business people interacting, laptops on top, and numbered text sections on the side.
Add to Wishlist
Download
AI Customize
Big data analytics slide deck with colorful charts, showcasing types, benefits, and decision making aids.
Add to Wishlist
Download
AI Customize
Infographic illustrating the four key dimensions of Big Data with associated definitions and icons.
Add to Wishlist
Download
AI Customize
Big data architecture diagram showing a flow from data ingestion, staging, and access to insights, with components.
Free
Add to Wishlist
Download
AI Customize
Three stacked cylinder diagrams in green and purple, connected by arrows to a central circle, set against a gray background.
Add to Wishlist
Download
AI Customize
Three teal outlined rectangular boxes featuring data visualization illustations in blue theme and bullet points below.
Add to Wishlist
Download
AI Customize
A teal server icon at the top with yellow and pink details, connected to three pie charts labeled below.
Add to Wishlist
Download
AI Customize
Folder icon with a magnifying glass on the left, alongside four numbered circles with descriptions in a beige theme.
Add to Wishlist
Download
AI Customize
Isometric illustration of data servers, a laptop, and businesspeople with text about data visualization on the left.
Add to Wishlist
Download
AI Customize
Infographic layout with four colored gears arranged vertically, each featuring icons and text boxes on a white background.
Add to Wishlist
Download
AI Customize
Big Data slide shows a quadrant with complexity versus business value, highlighting predictive analytics on a dark backdrop.
Add to Wishlist
Download
AI Customize
Big data slide showcasing sectors with healthcare, science, security, and business with adaptation notes with icons.
Add to Wishlist
Download
AI Customize
Big data presentation with charts, diagrams, and clean layouts to visualize data insights and analytics effectively.
Free
Add to Wishlist
Download
AI Customize
Big data layout with connected pathways from data storage to various output applications and platforms.
Add to Wishlist
Download
AI Customize
PowerPoint slide showing a data center graphic with pie charts representing different percentages and captions.
Add to Wishlist
Download
AI Customize
Big Data slide with data waves, network lines, charts, icons, blue theme, and structured text holders.
Add to Wishlist
Download
AI Customize
A data center slide featuring an illustration of a server rack at the center, with percentage indicators for data metrics.
Add to Wishlist
Download
AI Customize
Collection of slides focused on privacy and big data, showcasing colorful charts, icons, and textual descriptions.
Add to Wishlist
Download
AI Customize
Big data infographics slide deck with various visualization elements like charts, graphs, and icons in colorful layouts.
Add to Wishlist
Download
AI Customize
Infographic with a server icon linked to four pie charts in blue, each with captions and percentage labels.