Editable 10Vs Of Big Data PowerPoint And Google Slides

Editable 10Vs Of Big Data PowerPoint And Google Slides
P.ID : 71882
    514 views
    94 Downloads
    Get Custom Slides by Experts
    Instantly Access Templates in PowerPoint

    Creative 10Vs Of Big Data PowerPoint Slide


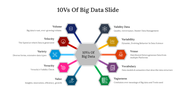
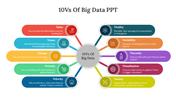
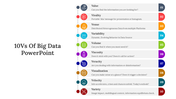
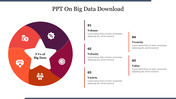
    The 10Vs of big data redefine data understanding, transcending conventional attributes to encompass volume, velocity, veracity, value, and vulnerability. This framework is pivotal for data scientists and analysts, guiding through the intricacies of large datasets for informed decision-making. The accompanying PowerPoint is a versatile tool, crafted for clarity and accessibility. With visual aids and narrative precision, it simplifies complex concepts for a broad audience. Fully editable to meet diverse presentation needs, the template serves as an educational asset, fostering engagement and highlighting the advantages of comprehending the 10Vs for optimizing data strategies in the dynamic landscape of big data.


    Features of this template


    • Features of the templates:
    • 100% customizable slides and easy to download.
    • Slide are available in different nodes & colors.
    • The slide contains 16:9 and 4:3 formats.
    • Easy to change the colors of the slide quickly.
    • Highly compatible with PowerPoint and Google Slides.
    • Well-crafted template with an instant download facility.
    Advertisement

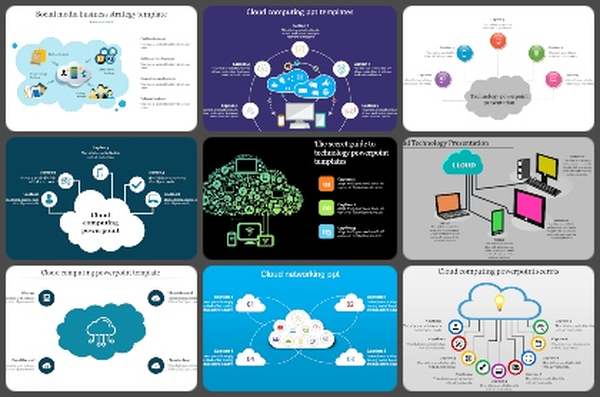
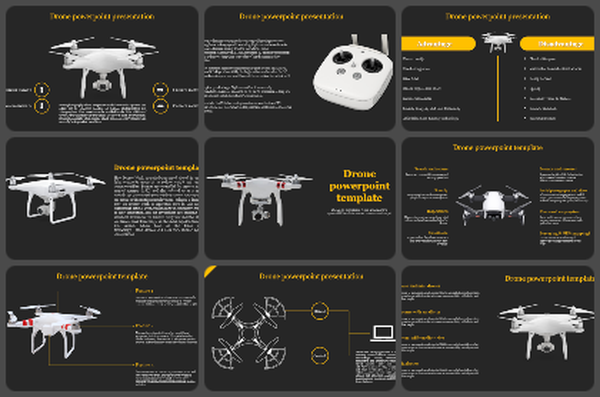
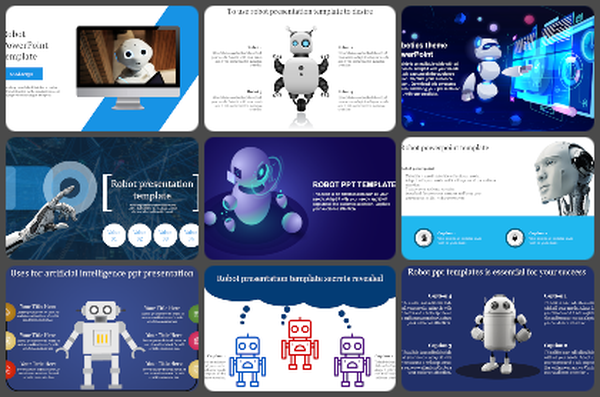
    You May Also Like These PowerPoint Templates

    Free
    Add to Wishlist
    Download
    AI Customize
    Three stacked cylinder diagrams in green and purple, connected by arrows to a central circle, set against a gray background.
    Add to Wishlist
    Download
    AI Customize
    Big data-related slide with four icons and progress bars on the left, and a percentage-based bar graph on the right.
    Add to Wishlist
    Download
    AI Customize
    Three teal outlined rectangular boxes featuring data visualization illustations in blue theme and bullet points below.
    Add to Wishlist
    Download
    AI Customize
    A teal server icon at the top with yellow and pink details, connected to three pie charts labeled below.
    Add to Wishlist
    Download
    AI Customize
    Folder icon with a magnifying glass on the left, alongside four numbered circles with descriptions in a beige theme.
    Add to Wishlist
    Download
    AI Customize
    Isometric illustration of data servers, a laptop, and businesspeople with text about data visualization on the left.
    Add to Wishlist
    Download
    AI Customize
    Infographic layout with four colored gears arranged vertically, each featuring icons and text boxes on a white background.
    Add to Wishlist
    Download
    AI Customize
    Big Data slide shows a quadrant with complexity versus business value, highlighting predictive analytics on a dark backdrop.
    Add to Wishlist
    Download
    AI Customize
    Big data slide showcasing sectors with healthcare, science, security, and business with adaptation notes with icons.
    Add to Wishlist
    Download
    AI Customize
    Dark themed slide with five teal outlined boxes containing icons and descriptions about big data benefits.
    Free
    Add to Wishlist
    Download
    AI Customize
    Big data layout with connected pathways from data storage to various output applications and platforms.
    Add to Wishlist
    Download
    AI Customize
    PowerPoint slide showing a data center graphic with pie charts representing different percentages and captions.
    Add to Wishlist
    Download
    AI Customize
    A data center slide featuring an illustration of a server rack at the center, with percentage indicators for data metrics.
    Add to Wishlist
    Download
    AI Customize
    Collection of slides focused on privacy and big data, showcasing colorful charts, icons, and textual descriptions.
    Add to Wishlist
    Download
    AI Customize
    Big data infographics slide deck with various visualization elements like charts, graphs, and icons in colorful layouts.
    Add to Wishlist
    Download
    AI Customize
    Infographic with a server icon linked to four pie charts in blue, each with captions and percentage labels.
    Add to Wishlist
    Download
    AI Customize
    10Vs of Big Data slide detailing from value to variety with color coded icons and text description.