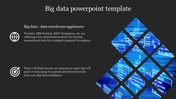
Effective Big Data Presentation PowerPoint Template

Infographic illustrating the four key dimensions of Big Data with associated definitions and icons.
P.ID : 68316
    540 views
    54 Downloads
    Get Custom Slides by Experts
    Instantly Access Templates in PowerPoint

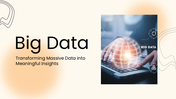
    Desirable Big Data Presentation Template

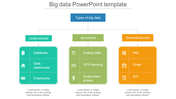
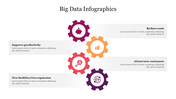
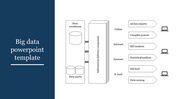
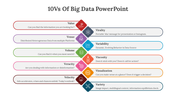
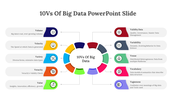
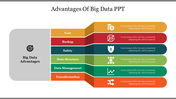
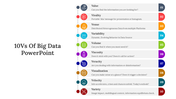
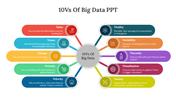
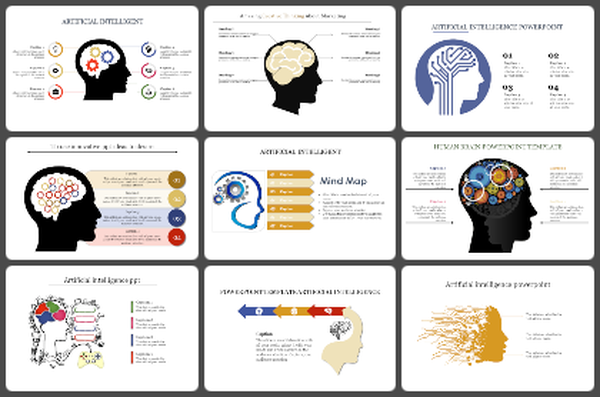
    What kind of data is tagged as "big data"? What distinguishes it from traditional data? Answer these Big Data-related questions on a separate slide using the appropriate illustrations. Grab this Big Data Slide to describe some criteria for this vast area using its elements like velocity, volume, and variety. The design has many icons to help you share your ideas without ambiguity. Big data is most frequently kept in computer databases and examined with software made to deal with enormous, complex data volumes. Therefore, thoroughly explain this term to your business people so they can keep informed for more advanced results. Stop being so outdated!

    Features of the template

    • 100 % customizable slides and easy to download.
    • Slides are available in different colors
    • The slide has 4:3 and 16:9 formats.
    • Easy to change the slide colors quickly.
    • Appealing presentation to impress an audience.
    • Create feature-rich slide presentations. 
    • An eye-pleasing color slide helps to give a catchy presentation.
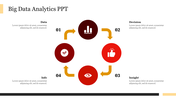
    • Multi-circular nodes with multi-colors.
    Advertisement

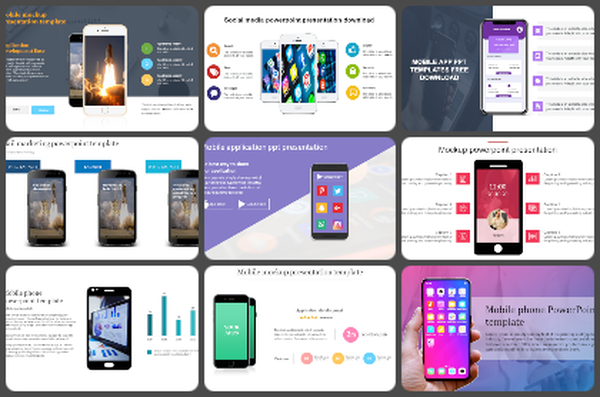
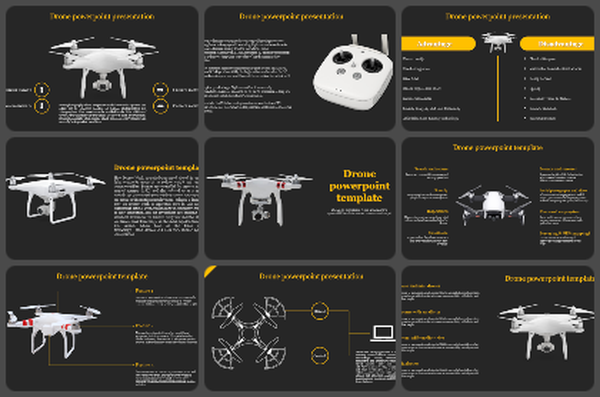
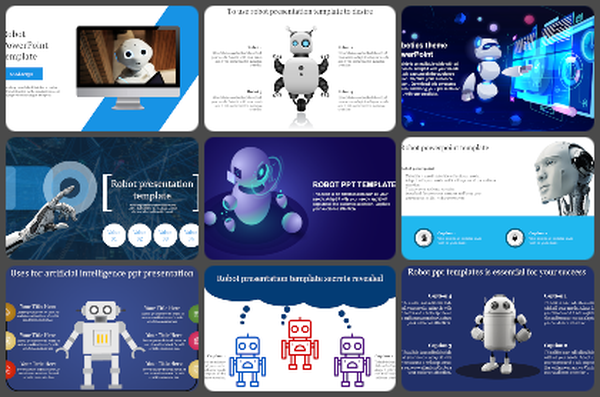
    You May Also Like These PowerPoint Templates

    Add to Wishlist
    Download
    AI Customize
    Illustration of a database and servers in a yellow box, with four numbered points placed around it.
    Add to Wishlist
    Download
    AI Customize
    Illustration of three data servers with colored panels, and numbered caption boxes on the right, on a blue background.
    Add to Wishlist
    Download
    AI Customize
    Illustration of women with large data visualizations on the left and placeholder text explaining the benefits.
    Add to Wishlist
    Download
    AI Customize
    Database PowerPoint Template For Presentation
    Add to Wishlist
    Download
    AI Customize
    Server illustration at the top, linked to four green pie charts below, showing varying percentages and captions.
    Add to Wishlist
    Download
    AI Customize
    A radial diagram in multiple colors displaying ten segments, each labeled with a different aspect of big data.
    Add to Wishlist
    Download
    AI Customize
    Data center slide with server icon above three pie charts labeled with captions below.
    Add to Wishlist
    Download
    AI Customize
    3D layered data visualization with business people interacting, laptops on top, and numbered text sections on the side.
    Add to Wishlist
    Download
    AI Customize
    Big data analytics slide deck with colorful charts, showcasing types, benefits, and decision making aids.
    Add to Wishlist
    Download
    AI Customize
    Infographic illustrating the four key dimensions of Big Data with associated definitions and icons.
    Add to Wishlist
    Download
    AI Customize
    Big data architecture diagram showing a flow from data ingestion, staging, and access to insights, with components.
    Free
    Add to Wishlist
    Download
    AI Customize
    Three stacked cylinder diagrams in green and purple, connected by arrows to a central circle, set against a gray background.
    Add to Wishlist
    Download
    AI Customize
    Big data-related slide with four icons and progress bars on the left, and a percentage-based bar graph on the right.
    Add to Wishlist
    Download
    AI Customize
    Three teal outlined rectangular boxes featuring data visualization illustations in blue theme and bullet points below.
    Add to Wishlist
    Download
    AI Customize
    A teal server icon at the top with yellow and pink details, connected to three pie charts labeled below.
    Add to Wishlist
    Download
    AI Customize
    Folder icon with a magnifying glass on the left, alongside four numbered circles with descriptions in a beige theme.
    Add to Wishlist
    Download
    AI Customize
    Isometric illustration of data servers, a laptop, and businesspeople with text about data visualization on the left.
    Add to Wishlist
    Download
    AI Customize
    Infographic layout with four colored gears arranged vertically, each featuring icons and text boxes on a white background.
    Add to Wishlist
    Download
    AI Customize
    Big Data slide shows a quadrant with complexity versus business value, highlighting predictive analytics on a dark backdrop.