Innovative Bar Chart PPT Template And Google Slides-3 Node

A PPT slide with a yellow bar chart displaying data from 2016 to 2021, along with labeled sections for each bar chart.
P.ID : 25976
    284 views
    17 Downloads
    Get Custom Slides by Experts
    Instantly Access Templates in PowerPoint

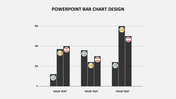
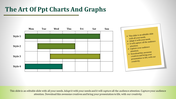
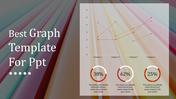
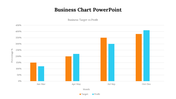
    Bar Chart PPT Template Presentation


    How can I make my bar graph stand out? We know that clearly articulated and eye-catching graphs do require much time to put them together. So, here is our new bar chart PPT template for you to present data with clarity and precision.

    Slide Description:

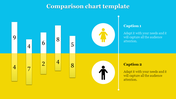
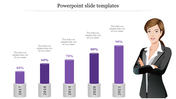
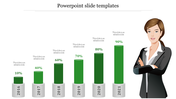
    Four-Year Comparison: It includes a chart that can show the four-year comparison. This makes it very convenient for you to look at the trend for how long it has occurred. Be it sales data or the number of visitors to a site, this chart can work well in displaying how you have fared in your activity.
    Editable Design: Each of the bar charts has three colors, and designated color-coded text areas are located at the bottom where one can easily personalize the information.

    Who will find this template useful?

    This template is useful for varied types of presentations, from business reports to marketing campaigns.

    So, just click on the download button and start saving time and effort today. Start making your data sing in your next presentation.

    Features of the template


    • 100% customizable slides and easy to download.
    • The slides contain 16:9 and 4:3 formats.
    • Easy to change the colors quickly.
    • It is a well-crafted template with an instant download facility.
    • It is a 100% pre-designed slide.
    • The slide holds vibrant colors.
    Advertisement

    You May Also Like These PowerPoint Templates

    Add to Wishlist
    Download
    AI Customize
    Company annual report slide featuring financial data including net income, assets, deposits, and shareholders' equity.
    Add to Wishlist
    Download
    AI Customize
    Slide with a pie chart and a numbered list of five levels, each in orange, red, blue, green, and yellow.
    Add to Wishlist
    Download
    AI Customize
    Company annual report template featuring a line chart with two data series and space for points and descriptions with text.
    Free
    Add to Wishlist
    Download
    AI Customize
    Timeline slide with horizontal bars in shades of green and blue, aligned to weekdays with placeholder text.
    Free
    Add to Wishlist
    Download
    AI Customize
    KWL chart PowerPoint template with sections for What I Know, What I Want to Know, and What I Learned with placeholder text.
    Add to Wishlist
    Download
    AI Customize
    Slide with three donut shaped percentage charts showing 70%, 50%, and 90%, with corresponding captions beneath each.
    Add to Wishlist
    Download
    AI Customize
    Gantt chart in blue tones, showing task progress over weeks with horizontal bars and assigned team members.
    Add to Wishlist
    Download
    AI Customize
    Simple Bar Chart Layout PowerPoint Presentation
    Free
    Add to Wishlist
    Download
    AI Customize
    A PPT chart template featuring a table layout with rows labeled Text and columns with bar charts in different shades of blue.
    Add to Wishlist
    Download
    AI Customize
    Bar chart slide design with stacked bars showing three categories per item and percentage captions on the left.
    Add to Wishlist
    Download
    AI Customize
    Business column chart template showing four bar sections, each representing industries with icons and data percentages.
    Add to Wishlist
    Download
    AI Customize
    Colorful bar chart slide for an annual report in PowerPoint, displaying monthly data from January to December.
    Add to Wishlist
    Download
    AI Customize
    PowerPoint template with two bar charts, one green, and one blue, representing four categories.
    Add to Wishlist
    Download
    AI Customize
    Colorful bar chart PPT template displaying four sections with data values and corresponding captions for 2018 to 2021.
    Add to Wishlist
    Download
    AI Customize
    Gantt chart with a task breakdown, progress percentages, and a status table for project planning and execution.
    Free
    Add to Wishlist
    Download
    AI Customize
    Line chart with data points marked by blue squares and black dots, displaying values from 2006 to 2014.
    Add to Wishlist
    Download
    AI Customize
    Gantt chart with colorful horizontal bars spanning from January to June, representing project timelines and milestones.
    Free
    Add to Wishlist
    Download
    AI Customize
    PowerPoint slide with a bar chart showcasing three data series for different examples.
    Add to Wishlist
    Download
    AI Customize
    Chart layout with stacked bar graphs in red, yellow, green, and teal representing A1 to A8, with captions above.