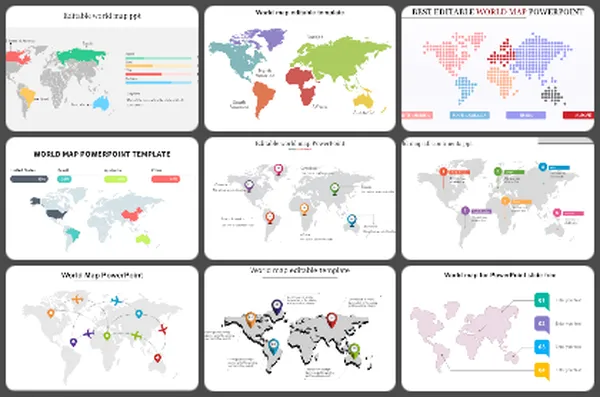
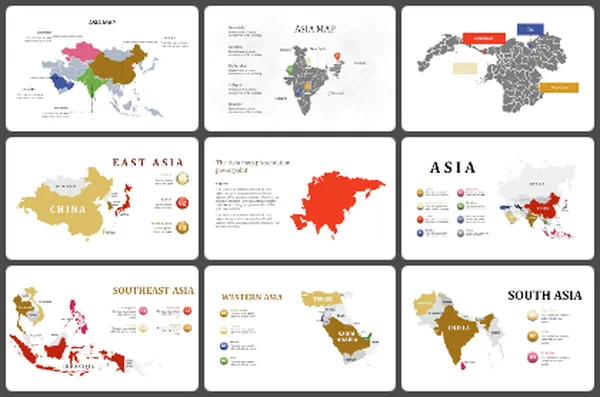
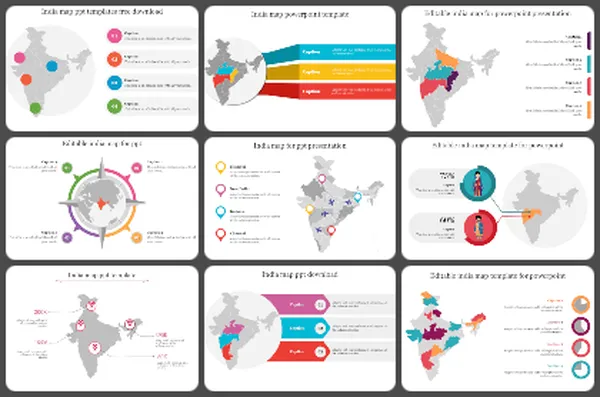
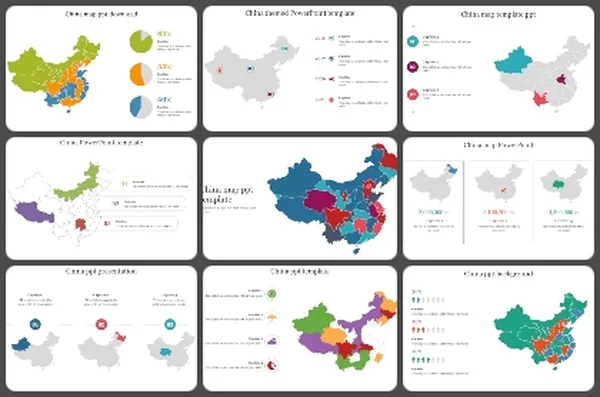
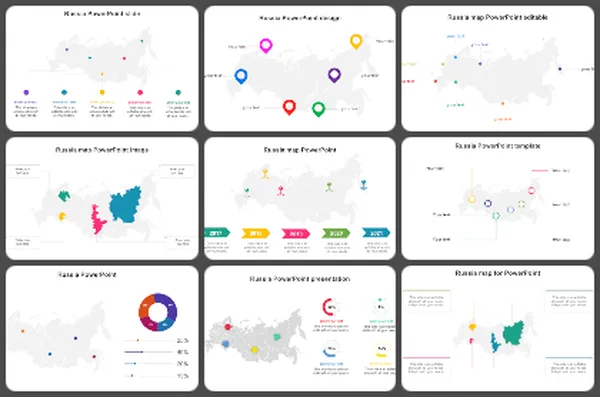
1280+ Maps Presentation Templates

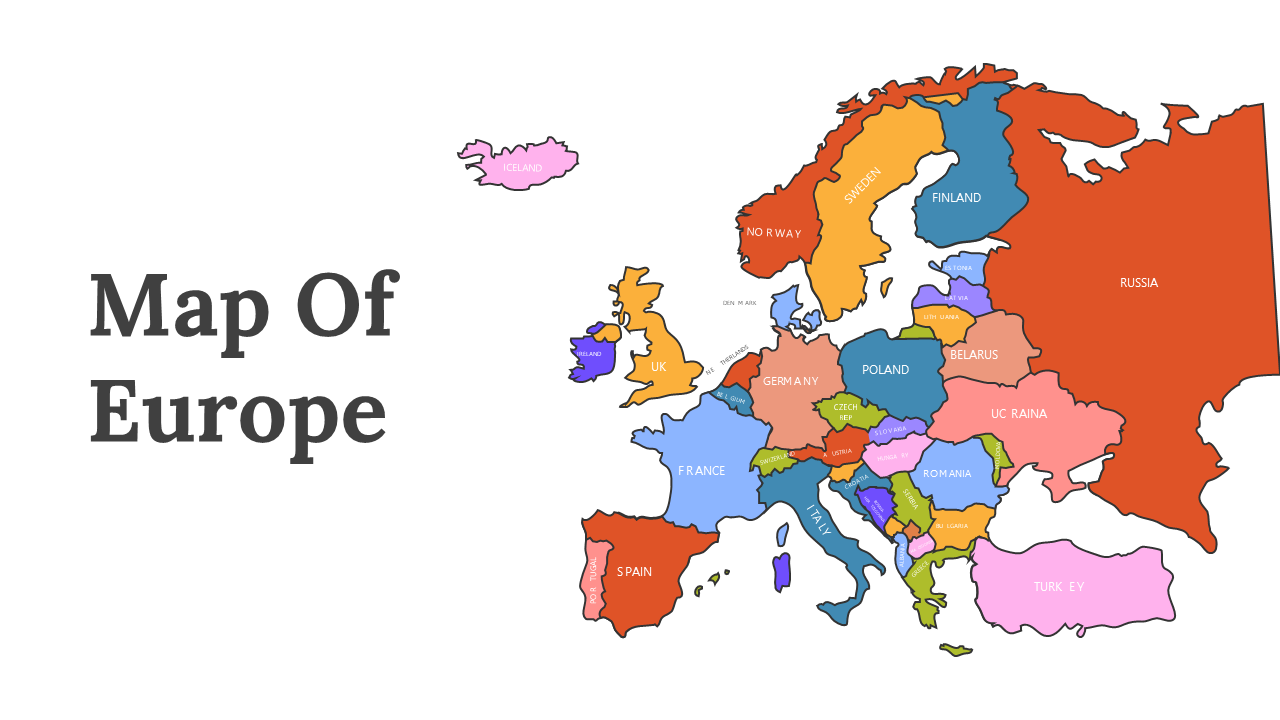
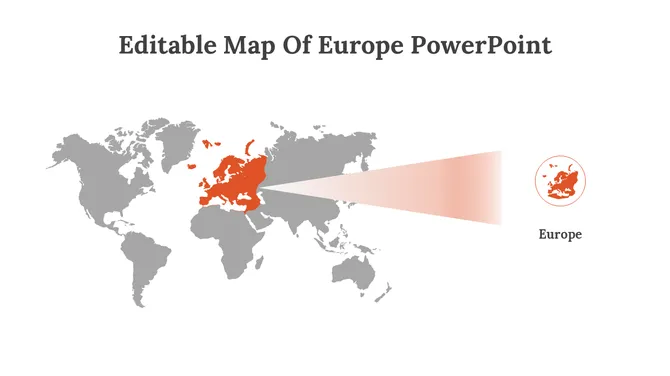
You're sharing something about places – teaching geography, showing sales territories, explaining a project location, planning an event. Your audience needs to visualize WHERE it is. Without a map, they're left imagining.

Got a Unique Idea? Craft with AI
PRO
Credits left : 0
Free
Add to Wishlist
Download
AI Customize
Gray outline map of Egypt with four colorful markers indicating key locations, each linked to corresponding captions.
Add to Wishlist
Download
AI Customize
Colorful map of Indonesia with four percentage markers in orange, purple, teal, and red, with captions on each side.
Add to Wishlist
Download
AI Customize
Illustration of a Paris map featuring various colored markers linked to captions, showing percentage values for each section.
Add to Wishlist
Download
AI Customize
Color coded ecuador map slide highlighting key regions with text areas for manabi, pichincha, guayas, and los rios.
Free
Add to Wishlist
Download
AI Customize
 Creative Japan Map Infographics PowerPoint Presentation
Add to Wishlist
Download
AI Customize
Slide deck featuring Egypt map infographics in yellow, brown, and gray tones, with charts and icons for data visualization.
Add to Wishlist
Download
AI Customize
Infographic slides on America with maps, charts, and icons, covering regional data and insights across multiple countries.
Add to Wishlist
Download
AI Customize
Editable Us Map PowerPoint Download Design PPT Slide
Add to Wishlist
Download
AI Customize
Gray printable map of Vietnam highlighting four regions Nghe An, Lang Son, Quang Nam, and Binh Phuoc.
Free
Add to Wishlist
Download
AI Customize
India map in gray with two highlighted markers, in orange and blue along with percentage bars and placeholder text.
Add to Wishlist
Download
AI Customize
Indonesia map with regions in various colors and five icons representing different locations, each linked to captions areas.
Add to Wishlist
Download
AI Customize
Map of India showing four colored markers for different states, with state names and colored arrows on the right.
Add to Wishlist
Download
AI Customize
A colorful map of Myanmar on the left and text on the right with a bulleted list of  features.
Add to Wishlist
Download
AI Customize
Map of Vietnam with four highlighted areas in green, pink, blue, and purple, each with corresponding icons.
Free
Add to Wishlist
Download
AI Customize
World map with countries highlighted in red, green, and yellow, with corresponding captions on the right.
Add to Wishlist
Download
AI Customize
Informative slides showcasing the geography of Saudi Arabia, including maps and various statistical data.
Add to Wishlist
Download
AI Customize
India map with four colorful location markers and airplane icons, with a key listing city names on the left.
Add to Wishlist
Download
AI Customize
Illustrated 3-D map of the Middle East showing labeled countries: Turkey, Iran, Egypt, and Saudi Arabia with caption area.
Free
Add to Wishlist
Download
AI Customize
US map with Asian region connections marked by social media icons accompanied by percentage bars for each platform.
Add to Wishlist
Download
AI Customize
Modern 3D infographic of Australia showcasing buildings, trees with capytion areas on a vibrant background.
Add to Wishlist
Download
AI Customize
Illinois map with five numbered colorful circles, with corresponding text, and horizontal bar graphs at the left.
Free
Add to Wishlist
Download
AI Customize
Colorful slide deck map of the United States with each state in different shades, showcasing population data.
Add to Wishlist
Download
AI Customize
World map PowerPoint slide highlighting North America, Europe, Russia, and China with respective population data.

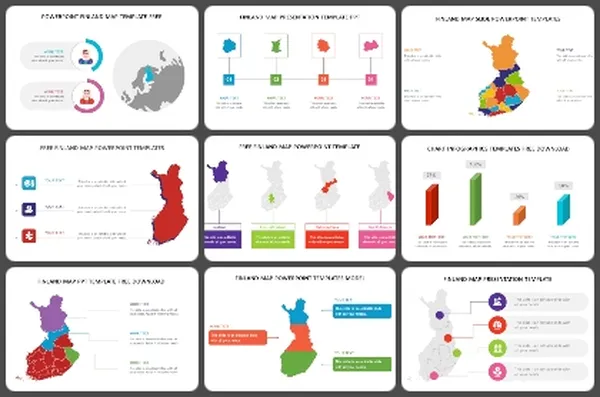
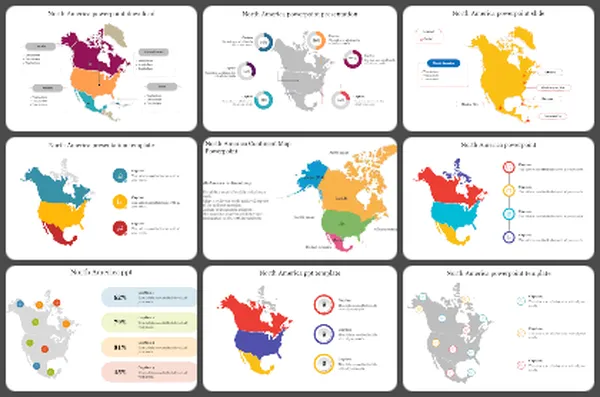
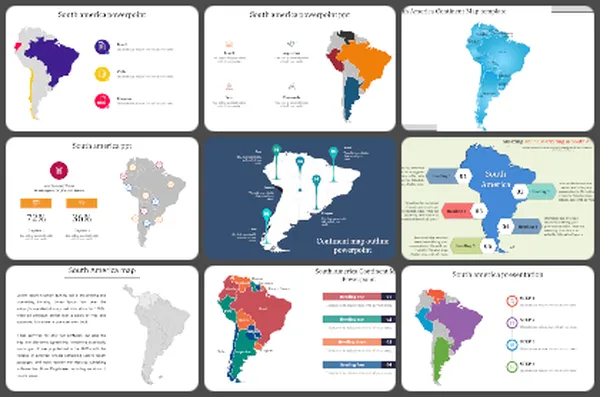
Find Your Way with Powerful Free Maps PowerPoint Templates and Google Slides Themes!


Ever need to show places or regions in your presentation? Maps are a fantastic way to grab attention and make your information clear. However, creating a great map presentation can be tricky. That's where our maps presentation templates come in!

Why are map presentations important?

Map presentations are vital because they help convey information about places and data visually. With maps, you can show locations, trends, and patterns in a way that everyone can understand. Our slides will help you create awesome presentations. They make it easy for you to share information about different places and data points in a clear and engaging way. They stand out because of their design elements, colors, and ease of use. With features like multicolor editable graphics, you can create presentations that wow your audience every time.

What do we offer?

Our category boasts an impressive collection of map PowerPoint templates. You'll find a wide range of themes here, from world maps to country maps and even city maps. We offer maps of many countries, including Egypt, Iran, Portugal, Great Britain, India, Brazil, Ukraine, Pakistan, Kenya, Israel, Singapore, Vietnam, Hong Kong, etc. Plus, our slides come with customizable features like multicolor infographic slides, editable graphics, and text placeholders.

Who can use our map slides?

Anyone who needs to present geographic information can benefit from our slides. Whether you're a teacher, geographer, travel agent, business owner, or travel enthusiast, our templates are perfect for you. You can use them in classrooms, boardrooms, or even during your next adventure.

Features and benefits:

  • Royalty-free: No need to worry about copyright issues.
  • 100% editable: Customize the slides to suit your needs.
  • Available in multiple formats (4:3 & 16:9): Choose the format that works best for your presentation.
  • Available in multiple orientations (portrait & landscape): Flexibility to fit any screen or layout.
  • Free slides available: Try before you buy!

Ready to elevate your presentations? Don't miss out on the opportunity to make your presentations unforgettable. Download our map presentation templates today and start impressing your audience with captivating visuals and engaging content.

Related Collections

Frequently Asked Questions

1. How do I know when my customized map template is ready to present?

When someone unfamiliar with your topic looks at it and immediately understands: What geography is this? What's being shown? Why does it matter? If they need you to explain the map, it's not clear enough yet. Refine until the map speaks for itself. Your job is to support the map with your words, not explain what the map should already show clearly.

2. I have a map template but don't know where to start — how do I customize it for my specific locations?

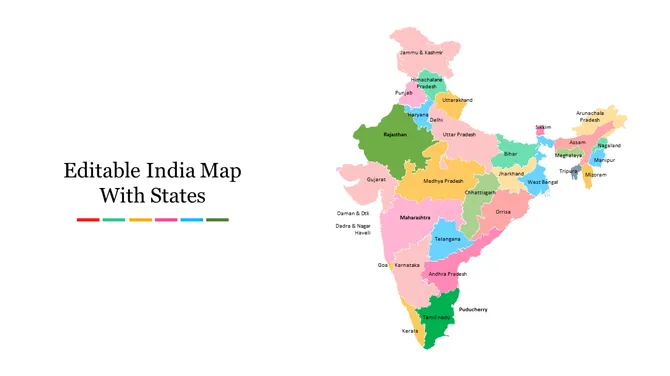
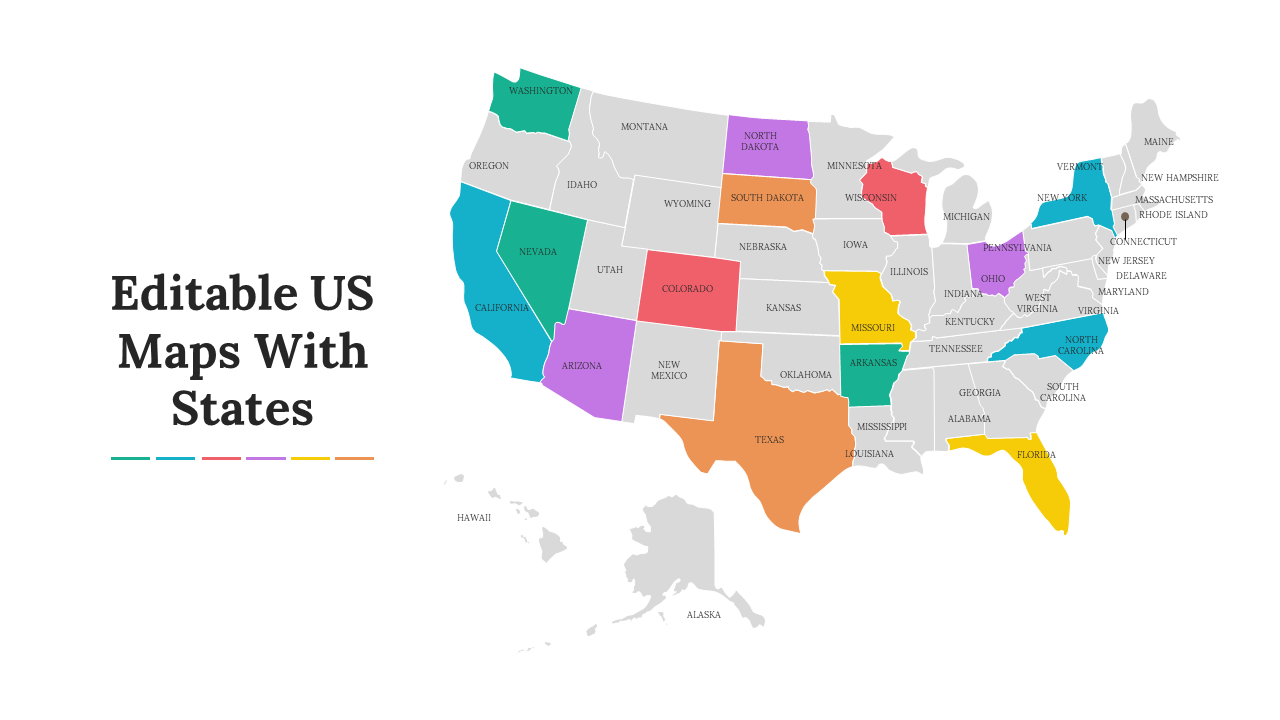
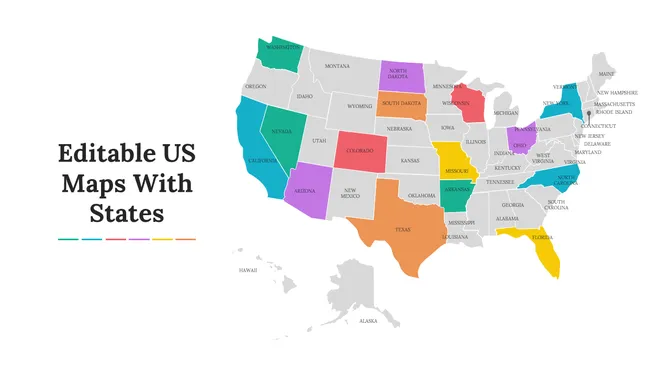
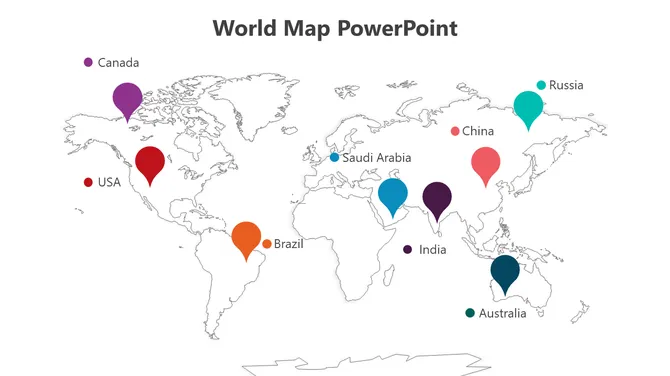
Open the template and identify what you need to change. If it's a US map and you need to highlight specific states, color those states. If it's a world map and you need to mark specific countries, add markers there. Start with what matters to YOUR message. Edit only what's necessary. Remove what doesn't apply. The template gives you the structure — you add your specific information.

3. How do I add my information to a map template so it's clear what I'm showing?

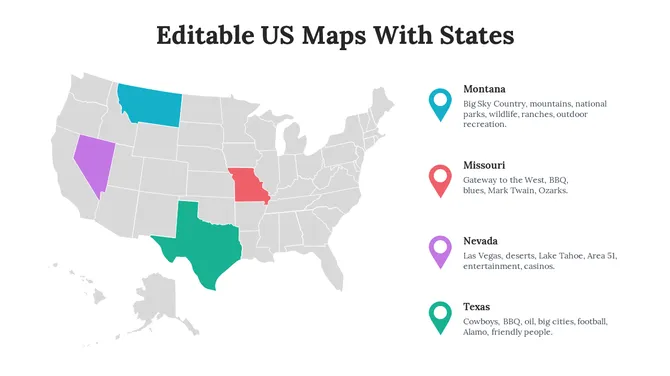
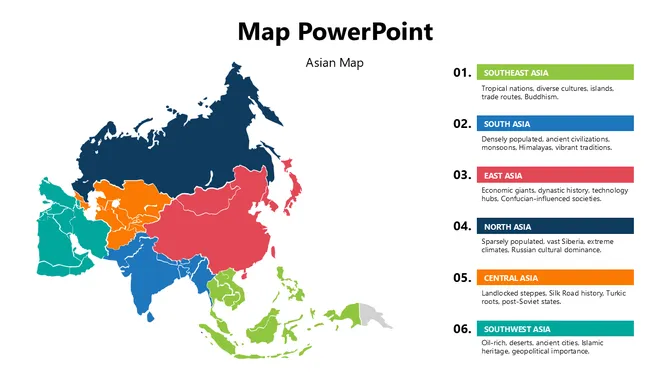
Use the template's built-in features — colors, labels, markers, shapes. If highlighting regions, use color-coding. If marking locations, use the marker tool. Add labels so people know what they're looking at. Keep it simple. Every element should answer a question: "What am I showing here?" If it doesn't serve that purpose, remove it.

4. My map template has too much detail for what I need — how do I simplify it?

Delete what doesn't matter to your message. If you only need three regions highlighted, hide or remove the others. If you don't need every city labeled, remove those labels. Templates give you options — use only what you need. A cleaner map is easier to understand. Don't feel obligated to use every element in the template.

5. How do I make sure my customized map template communicates clearly to my audience?

Add a title that explains what the map shows. Use a legend if you're using colors or symbols. Label important locations. Keep colors consistent — one color should mean the same thing throughout. Test it: Can someone understand your map in 5 seconds without explanation? If not, simplify further. Clarity comes from removing confusion, not adding information.

6. I'm using multiple maps in my presentation — how do I keep them consistent?

Use the same color scheme across all maps. If red means "high" in one map, red should mean "high" in all maps. Use the same font for labels. Consistent formatting helps your audience follow the story. They see the first map, understand the pattern, and understand subsequent maps faster. Consistency reduces cognitive load.

7. How do I edit the map template if I don't have design experience?

Templates are designed to be user-friendly. Most editing is drag-and-drop or click-to-change-color. You don't need design skills — just common sense. Click on what you want to change. Experiment. If you make a mistake, undo it. The template is there to support you, not confuse you. Start simple and add complexity only if needed.