Free - Inventive PowerPoint Speedometer Template Presentation

Free
Speedometer diagram PPT slide showing a gauge with markings ranging from 5.5 KM to 8 KM, with a description.
P.ID : 35625
    123 views
    21 Downloads
    Get Custom Slides by Experts
    Instantly Access Templates in PowerPoint

    Rev Up Your Data Presentation with the Speedometer PowerPoint Template


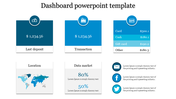
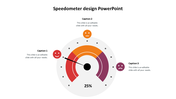
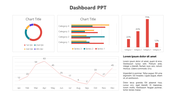
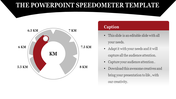
    A dashboard provides a visual representation of your key performance indicators, making it easier to track and analyze data. The "Speedometer PowerPoint Template and Google Slides Themes" is designed to deliver impactful and dynamic presentations. This template features a purple-themed speedometer complete with numerical indicators and a description text area, allowing users to modify text to suit their specific needs.

    Perfect for business reviews, performance tracking, and strategic planning, this template helps you present critical metrics with clarity and precision. The visual appeal of the speedometer makes it easy to highlight performance levels and trends, ensuring your audience quickly grasps essential data. Use this template to enhance your presentations and make your data-driven insights stand out.

    Features of this template:


    • 100 % customizable slides are easy to download. 
    • Slides are available in different nodes and colors.
    • The slide was contained in 16:9 and 4:3 formats.
    • It is easy to change the slide colors quickly.
    • Well-crafted template with an instant download facility.
    • The clear layout of this template will help you design a professional-looking presentation.
    • The multi-color visuals on this slide will make your presentation eye-catching.
    Advertisement

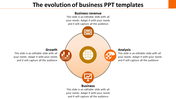
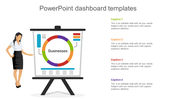
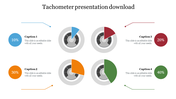
    You May Also Like These PowerPoint Templates

    Add to Wishlist
    Download
    AI Customize
    Business dashboard slide with a monitor displaying charts and graphs, paired with four colored icons and captions.
    Add to Wishlist
    Download
    AI Customize
    Slide design featuring three green speedometer graphics displaying different progress levels, each paired with a caption.
    Add to Wishlist
    Download
    AI Customize
    Dashboard slide featuring six sections with graphs and metrics for annual performance in blue and green.
    Add to Wishlist
    Download
    AI Customize
    Effective Dashboard PowerPoint Templates Design
    Add to Wishlist
    Download
    AI Customize
    Dashboard slide with a circular chart in blue shades, featuring percentage labels, and five icons with text on the right.
    Add to Wishlist
    Download
    AI Customize
    Dashboard slide with a pie chart, stacked area chart, and multiple colored rectangular boxes displaying metrics.
    Add to Wishlist
    Download
    AI Customize
    Best Dashboard Sales Performance Reports Revenue Charts
    Add to Wishlist
    Download
    AI Customize
    Dashboard with bar chart comparing planned vs. actual tasks for projects, pie chart for project share, and a line graph displaying project data.
    Add to Wishlist
    Download
    AI Customize
    Gray slide layout with a semicircular gauge in gradient colors of red, orange, and green, and a sidebar with text.
    Add to Wishlist
    Download
    AI Customize
    Dashboard layout with charts, graphs, and a world map in vibrant colors, showcasing data visually.
    Add to Wishlist
    Download
    AI Customize
    Circular gauge template with sections in red, orange, yellow, green, and dark green, with captions on either side.
    Add to Wishlist
    Download
    AI Customize
    Infographic dashboard featuring a world map with COVID-19 case data, a gender-based death rate chart, and a pie chart.
    Add to Wishlist
    Download
    AI Customize
    PowerPoint slide for executive dashboard featuring four icons target, speed, error reduction, and growth with text area.
    Add to Wishlist
    Download
    AI Customize
    KPI dashboard template PowerPoint slide featuring three sections for data visualization.
    Add to Wishlist
    Download
    AI Customize
    Dashboard layout including a bar chart of company data, a pie chart for quarterly sales distribution.
    Free
    Add to Wishlist
    Download
    AI Customize
    Pie chart in orange, red, green, and blue sections with two text labels on either side, highlighting sales performance.