Versatile Matrix Presentation Template for Data Analysis

Risk matrix chart showing nine colored boxes for low, medium, and high risk levels by impact and probability.
P.ID : 26429
    248 views
    17 Downloads
    Get Custom Slides by Experts
    Instantly Access Templates in PowerPoint

    Risk Matrix Presentation Template and Google Slides Themes


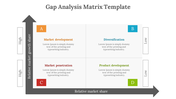
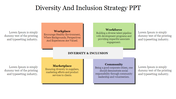
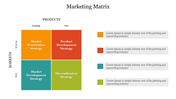
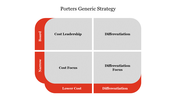
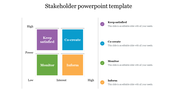
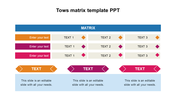
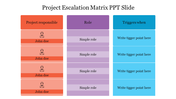
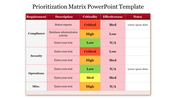
    Showcase the significance of matrices with our sophisticated PowerPoint template and Google Slides design. This template features a graph filled with three different colors of rectangles, representing high, medium, and low values, against a clean white background. The color-coded rectangles provide a clear and visually appealing way to highlight the importance and impact of various matrix elements.

    Ideal for business analysts, educators, project managers, and consultants, this template is perfect for presenting data analysis, strategic planning, risk assessment, and performance evaluations. Whether you're illustrating market segments, operational efficiencies, or risk matrices, this template ensures your audience grasps the key insights effortlessly. Present your data with clarity and precision using this professional and versatile matrix template.

    Features of the template


    • 100% customizable slides and easy to download.
    • Slides are available in different nodes & colors.
    • The slide contains 16:9 and 4:3 formats.
    • It is easy to change the colors of the slide quickly. 
    • Well-crafted template with an instant download facility.
    Advertisement

    You May Also Like These PowerPoint Templates

    Add to Wishlist
    Download
    AI Customize
    A slide showing a project escalation matrix with four colored arrows labeled 01 to 04, each with caption areas.
    Free
    Add to Wishlist
    Download
    AI Customize
    Informative BCG Matrix PPT Download Presentation Template
    Add to Wishlist
    Download
    AI Customize
    A four-quadrant grid with circular icons in blue, green, orange, and teal, each paired with a text area.
    Add to Wishlist
    Download
    AI Customize
    Detailed BCG Matrix PowerPoint Template for Analysis
    Add to Wishlist
    Download
    AI Customize
    4MAT model featuring four squares in different colors with brain hemisphere labels around it.
    Add to Wishlist
    Download
    AI Customize
    Ansoff matrix with nine colored squares illustrating market development and product extension strategies.
    Add to Wishlist
    Download
    AI Customize
    Matrix with four boxes for cost leadership, differentiation, cost focus, and differentiation focus in Porter's model.
    Add to Wishlist
    Download
    AI Customize
    Colorful 9 box grid slide displaying matrix categorizing employees based on performance and potential with labeled sections.
    Add to Wishlist
    Download
    AI Customize
    A slide illustrating the Moscow Method with four colored sections for prioritizing requirements.
    Add to Wishlist
    Download
    AI Customize
    Matrix diagram of risk management with colored blocks indicating risk levels across low to high likelihood and consequence.
    Add to Wishlist
    Download
    AI Customize
    Escalation matrix slide with priority levels P1 to P4 across scenarios S1 to S4, showing many statuses.
    Add to Wishlist
    Download
    AI Customize
    Ansoff Growth Matrix chart showing market and product strategies including penetration, development, and diversification.
    Free
    Add to Wishlist
    Download
    AI Customize
    Four green squares in a grid layout forming a matrix with gray accents, on a white background.
    Add to Wishlist
    Download
    AI Customize
    Four section BCG matrix in blue tones with a rising line graph, representing growth phases using icons and percentages.
    Add to Wishlist
    Download
    AI Customize
    Slide with rows for probability levels and columns for severity ratings, with color coded cells to indicate risk levels.
    Add to Wishlist
    Download
    AI Customize
    3D risk matrix with four green blocks labeled low, medium, and high, representing risk impact and probability.
    Add to Wishlist
    Download
    AI Customize
    Alignment chart showing categories from lawful good to chaotic evil, with a graphic icon in the center and placeholder text.
    Add to Wishlist
    Download
    AI Customize
    Best Moscow Method PowerPoint Presentation