Risk Matrix PowerPoint Template and Google Slides

3D risk matrix with four green blocks labeled low, medium, and high, representing risk impact and probability.
P.ID : 26447
    169 views
    2 Downloads
    Get Custom Slides by Experts
    Instantly Access Templates in PowerPoint

    Risk Matrix PowerPoint Template and Google Slides

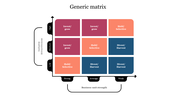
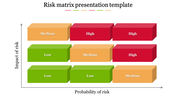
    The "Risk Matrix PowerPoint Template and Google Slides" feature a risk matrix, a tool used to assess and prioritize risks based on their probability and impact. The matrix is divided into four quadrants, representing different risk levels: low, medium, high, and extreme. The x-axis represents the probability of risk, while the y-axis represents the impact of risk. 

    This template is invaluable for project managers, risk analysts, business professionals, and anyone involved in risk management and decision-making processes. Utilize this template whenever you need to assess, analyze, or communicate risks within your organization or project. 

    Compatible with both PowerPoint and Google Slides, ensuring accessibility and versatility for users.Available in "16:9" and "4:3" aspect ratios, providing flexibility to accommodate different presentation preferences and screen sizes. Free template with 100% customization capabilities. Download the Risk Matrix PowerPoint Template and Google Slides now.
    Advertisement

    You May Also Like These PowerPoint Templates

    Add to Wishlist
    Download
    AI Customize
    A  layout showing a symmetrical infographic with four sections, each containing an icon and placeholder text.
    Add to Wishlist
    Download
    AI Customize
    Quad chart PowerPoint slide featuring four sections for analysis with colorful icons and captions with placeholder text.
    Add to Wishlist
    Download
    AI Customize
    Editable Eisenhower Method Templates PowerPoint Slide
    Add to Wishlist
    Download
    AI Customize
    Slide featuring a four part circle in red, yellow, blue, and green, with matching text boxes extending from each section.
    Free
    Add to Wishlist
    Download
    AI Customize
    Yellow BCG Matrix chart slide showing four categories Stars, Question, Cash, and Dogs, with market growth and share axes.
    Add to Wishlist
    Download
    AI Customize
    Editable Matrix PowerPoint Template Presentation
    Add to Wishlist
    Download
    AI Customize
    Business matrix diagram with four dark sections in a grid, showing different circular icons and directional arrows.
    Add to Wishlist
    Download
    AI Customize
    Colorful matrix organizational chart PPT template with four sections in red, blue, green, and yellow with placeholder text.
    Add to Wishlist
    Download
    AI Customize
    Branding slide featuring a quadrant with four blue captions, separated by labeled axes and headings.
    Free
    Add to Wishlist
    Download
    AI Customize
    Clean orange colored matrix chart with four sections, each presented in diagonal blocks on a white background.
    Add to Wishlist
    Download
    AI Customize
    Colorful matrix PowerPoint template with four triangular sections converging at a central circle, featuring an arrow motif.
    Add to Wishlist
    Download
    AI Customize
    A colorful matrix presentation template with a grid layout, red and yellow symbols, and text placeholders.
    Free
    Add to Wishlist
    Download
    AI Customize
    PowerPoint slide displaying a yellow matrix organization chart with categories for existing and new markets and products.
    Add to Wishlist
    Download
    AI Customize
    Stunning Matrix Organizational Structure Design Template
    Add to Wishlist
    Download
    AI Customize
    Our Predesigned Matrix Org Chart Templates Designs
    Add to Wishlist
    Download
    AI Customize
    Editable Stakeholder Map PowerPoint Template For Slides
    Add to Wishlist
    Download
    AI Customize
    BCG matrix with blue, yellow, green, and purple rectangles, arrows indicating existing and new markets and products.
    Add to Wishlist
    Download
    AI Customize
    9-box model chart with nine colored squares showing performance and potential showing performance in arrows.