Gap Analysis Matrix PowerPoint And Google Slides Themes

Matrix chart with four quadrants for market growth and share, labeled A to D in different colors, with arrows on both axes.
P.ID : 36007
    2.3K+ views
    103 Downloads
    Get Custom Slides by Experts
    Instantly Access Templates in PowerPoint

    Gap Analysis Matrix Presentation Slide

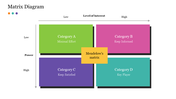
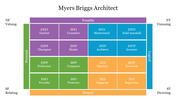
    A Gap Analysis Matrix is a tool used to identify the differences between current and desired states of a process or system. It provides a visual representation of the gaps between the two states, along with potential solutions to bridge those gaps. The matrix is typically organized into rows and columns, with the rows representing the current state and the columns representing the desired state. By identifying and addressing the gaps, organizations can improve their processes and systems and achieve their desired outcomes. Using this template can help you to keep your audience engaged and interested throughout your presentation.

    Features of the template:

    1. 100% customizable slide and easy to download.
    2. This slide has a colorful design pattern.
    3. The slide contains 16:9 and 4:3 formats.
    4. Easy to change the slide colors quickly.
    5. Well-crafted template with instant download facility.
    6. An excellent slide to present your business gap analysis findings.
    7. Highly compatible with PowerPoint and Google Slides.
    Advertisement

    You May Also Like These PowerPoint Templates

    Add to Wishlist
    Download
    AI Customize
    3x3 grid of circles in different colors, forming a matrix layout with axes, with a text area on the right.
    Add to Wishlist
    Download
    AI Customize
    Matrix layout of four colored squares in purple, red, green, and blue, with gray header and sidebar, each with text.
    Add to Wishlist
    Download
    AI Customize
    A grid-style SPACE matrix chart with four labeled quadrants in orange, blue, red, and green each with caption areas.
    Add to Wishlist
    Download
    AI Customize
    Slide pack with a brown and beige color scheme, displaying various Ansoff growth matrix layouts and charts.
    Add to Wishlist
    Download
    AI Customize
    Innovation Ambition PowerPoint Matrix and Google Slides
    Add to Wishlist
    Download
    AI Customize
    Eisenhower matrix with four colorful squares illustrating task urgency and importance in green, orange, teal, and purple.
    Add to Wishlist
    Download
    AI Customize
    Color coded 3x3 grid with red, yellow, and green boxes representing various performance and potential levels.
    Add to Wishlist
    Download
    AI Customize
    Risk matrix chart with color coded cells indicating risk severity, combining likelihood and consequence levels.
    Free
    Add to Wishlist
    Download
    AI Customize
    Slide displaying a BCG Matrix with labeled quadrants in multi colour, with descriptions of each product type.
    Add to Wishlist
    Download
    AI Customize
    Slide deck featuring a colorful skills matrix, with rows and columns, showing proficiency levels with color codes.
    Add to Wishlist
    Download
    AI Customize
    2x2 matrix slide showing four quadrants labeled with varying levels of impact and risk with four captions.
    Add to Wishlist
    Download
    AI Customize
    Circular diagram divided into quadrants in red, blue, green, and orange, showing different values and directions.
    Add to Wishlist
    Download
    AI Customize
    BCG matrix with four colored quadrants: yellow, blue, green, and orange, representing different business categories.
    Add to Wishlist
    Download
    AI Customize
    Four quadrant matrix with high and low labels, featuring red, purple, blue, and yellow boxes filled with placeholder text.
    Add to Wishlist
    Download
    AI Customize
    Test matrix example slide showcasing market strategies with product and market classifications with placeholder text.
    Add to Wishlist
    Download
    AI Customize
    BCG Matrix PowerPoint slide showing product categories with four colored text sections based on market growth and share.