Competing Values Framework PPT Template and Google Slides

Circular diagram divided into quadrants in red, blue, green, and orange, showing different values and directions.
P.ID : 57106
    526 views
    48 Downloads
    Get Custom Slides by Experts
    Instantly Access Templates in PowerPoint

    Use This Template For Illustrating About Competing Values:


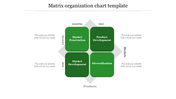
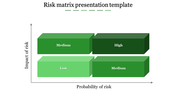
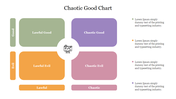
    Get this template downloaded to explain your various points and facts related to the competing values framework. You can add more flexibility, external, stability, and internal points. The diagram presented in the center is divided into four parts, like a pie chart that holds your caption inside them. 

    The colors used inside the nodes are unique ones that give a good and highlighting effect to the contents presented inside the diagram. This template can be used directly on your slides without any alteration since it is readymade. You can save your time drastically by downloading this Competing Values Framework template and explaining it in your presentation slide.

    Features Of This Template:

    • 100% customizable slides and easy to download
    • Slides are available in different nodes & colors.
    • The slides contained 16:9 and 4:3 format.
    • Easy to change the slide colors quickly.
    • Well-crafted template with instant download facility.
    • Crisp and elegant font style. 
    • The best template with attractive nodes
    Advertisement

    You May Also Like These PowerPoint Templates

    Add to Wishlist
    Download
    AI Customize
    BCG Matrix PowerPoint diagram slide showing the market growth rate and relative market share for products.
    Add to Wishlist
    Download
    AI Customize
    Ansoff matrix slide showing strategies for market and product development with four quadrants.
    Add to Wishlist
    Download
    AI Customize
    9 Box Model McKinsey framework slides categorizing employees into performance and potential quadrants with colorful layouts.
    Add to Wishlist
    Download
    AI Customize
    Slide displaying a BCG matrix, showing market growth rate against relative market share with labeled sections.
    Add to Wishlist
    Download
    AI Customize
    Eisenhower Matrix with four colored quadrants categorizing tasks based on urgency and importance, from do now to dump it.
    Add to Wishlist
    Download
    AI Customize
    A quadrant stakeholder map slide illustrating various strategies for managing stakeholder interest and engagement.
    Add to Wishlist
    Download
    AI Customize
    Matrix structure chart with a general manager overseeing multiple department managers and project teams.
    Add to Wishlist
    Download
    AI Customize
    A colorful decision matrix template featuring four quadrants labeled 01, 02, 03, and 04, with spaces for text descriptions.
    Add to Wishlist
    Download
    AI Customize
    Colorful 9 Box performance matrix showing employee potential versus performance with various rating categories.
    Add to Wishlist
    Download
    AI Customize
    Segmented puzzle design in red, purple, teal, and blue, illustrating strategic planning categories, with textual details.
    Add to Wishlist
    Download
    AI Customize
    Visual representation of the ulrich model, highlighting roles in strategic focus and operational focus quadrants.
    Add to Wishlist
    Download
    AI Customize
    Eisenhower matrix layout with four colorful quadrants in blue, red, yellow, and green, labeled by urgency and importance.
    Add to Wishlist
    Download
    AI Customize
    BCG matrix PowerPoint slide with icons and placeholder text.
    Add to Wishlist
    Download
    AI Customize
    Eisenhower matrix with four color coded quadrants in orange, green, red, and blue, divided by importance and urgency labels.
    Add to Wishlist
    Download
    AI Customize
    Matrix chart showing the relationship between products and markets with four categories and placeholder text.
    Add to Wishlist
    Download
    AI Customize
    BCG matrix with quadrants for growth rate and market share, including arrows and product bubbles.