Simple Eisenhower Matrix PowerPoint Presentation

Eisenhower Matrix with four colored quadrants categorizing tasks based on urgency and importance, from do now to dump it.
P.ID : 53974
    191 views
    15 Downloads
    Get Custom Slides by Experts
    Instantly Access Templates in PowerPoint

    Effective Eisenhower matrix PowerPoint

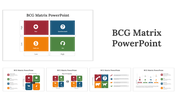
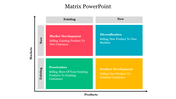
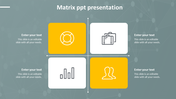
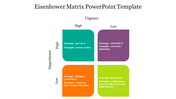
    Eisenhower matrix PowerPoint presentation is one of the best templates used for business presentations. The template is added with four nodes that are added with vibrant colors.

    The template is exclusive and can bring more information into the same template. The template is creative with text areas that you can add. Since this template is fully customized, it is easier to edit and download.

    Make use of the user-friendly way to enhance the view of the presentation. Try now! Make sure to download this exclusive template and gain the audience's attention.  

    Features of this template:

    1. 100% customizable slides
    2. easy to download.
    3. Slides available in different nodes & colors.
    4. The slide contained 16:9 and 4:3 format.
    5. Easy to change the slide colors quickly.
    6. Well-crafted template with instant download facility.
    7. Creative design with text area.

    Advertisement

    You May Also Like These PowerPoint Templates

    Add to Wishlist
    Download
    AI Customize
    A quadrant stakeholder map slide illustrating various strategies for managing stakeholder interest and engagement.
    Add to Wishlist
    Download
    AI Customize
    Matrix structure chart with a general manager overseeing multiple department managers and project teams.
    Add to Wishlist
    Download
    AI Customize
    Horizontal TOWS matrix with blue, yellow, red, and teal bars, each linked to circular strategy nodes on the right.
    Add to Wishlist
    Download
    AI Customize
    A colorful decision matrix template featuring four quadrants labeled 01, 02, 03, and 04, with spaces for text descriptions.
    Add to Wishlist
    Download
    AI Customize
    Colorful 9 Box performance matrix showing employee potential versus performance with various rating categories.
    Add to Wishlist
    Download
    AI Customize
    Segmented puzzle design in red, purple, teal, and blue, illustrating strategic planning categories, with textual details.
    Add to Wishlist
    Download
    AI Customize
    Visual representation of the ulrich model, highlighting roles in strategic focus and operational focus quadrants.
    Add to Wishlist
    Download
    AI Customize
    Eisenhower matrix layout with four colorful quadrants in blue, red, yellow, and green, labeled by urgency and importance.
    Add to Wishlist
    Download
    AI Customize
    BCG matrix PowerPoint slide with icons and placeholder text.
    Add to Wishlist
    Download
    AI Customize
    Customer growth matrix slides illustrating four strategies organized in a matrix format with different colored layout design.
    Add to Wishlist
    Download
    AI Customize
    Eisenhower matrix with four color coded quadrants in orange, green, red, and blue, divided by importance and urgency labels.
    Add to Wishlist
    Download
    AI Customize
    Matrix chart showing the relationship between products and markets with four categories and placeholder text.
    Add to Wishlist
    Download
    AI Customize
    BCG matrix with quadrants for growth rate and market share, including arrows and product bubbles.
    Add to Wishlist
    Download
    AI Customize
    Nine-box template showing performance versus potential, with labeled boxes for different employee types.
    Add to Wishlist
    Download
    AI Customize
    BCG matrix slide with quadrants labeled Stars, Question marks, Cash cow, and Poor dogs with placeholder text.
    Add to Wishlist
    Download
    AI Customize
    Nine colored boxes arranged in a 3x3 grid, representing various risk management categories, aligned by impact and likelihood.
    Add to Wishlist
    Download
    AI Customize
    Horizontal risk assessment diagram with stacked red bars showing risk levels on axes for impact and probability.