Effective Marketing PPT Templates for Business Strategies

Marketing slide showing a bar graph with percentage data over time and two cards with numbers representing marketing categories.
P.ID : 9377
    227 views
    3 Downloads
    Get Custom Slides by Experts
    Instantly Access Templates in PowerPoint

    Marketing Presentation Template

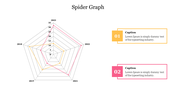
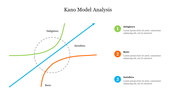
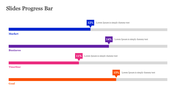
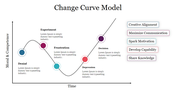
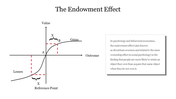
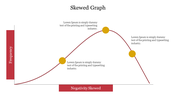
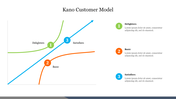
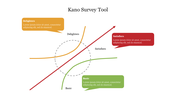
    In today's tough business world, good marketing is super important for success.  Our Marketing PowerPoint Template and Google Slides give you everything you need to explain your marketing ideas well. Whether you're sharing a new plan, checking out market trends, or showing how well your marketing is doing, a great presentation can help. It's got a cool orange background that makes your info pop. Plus, there are two charts you can change to fit your data perfectly.

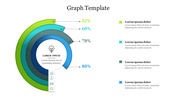
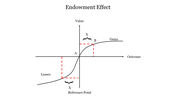
    There's even a graph to show how things are growing and how well you're doing. This template isn't just for pros – it's great for business owners, teachers, students, and anyone in marketing.  It's easy to use and customize, so you can make it just right for you. Download the Template now and make your presentations stand out!

    Features of the template:

    • Slides are available in different nodes & colors.
    • Easy to change the slide colors.
    • Well-crafted template with instant download.
    Advertisement

    You May Also Like These PowerPoint Templates

    Add to Wishlist
    Download
    AI Customize
    Graphics PowerPoint slide featuring five vertical progress bars with different percentages and icons with captions.
    Add to Wishlist
    Download
    AI Customize
    Story plot diagram with beginning, middle, and end sections in pastel colors, connected by icons on a line graph.
    Add to Wishlist
    Download
    AI Customize
    Graph illustrating the yearly findings of how to find PowerPoint templates from 2016 to 2023 with two data series.
    Free
    Add to Wishlist
    Download
    AI Customize
    Slide with green radar chart, satellite dish on the right, and two labeled statistical hexagonal sections below.
    Add to Wishlist
    Download
    AI Customize
    Line graph representing the Kubler Ross Model with seven emotional stages marked by colored points on a curve.
    Add to Wishlist
    Download
    AI Customize
    PowerPoint slide showing a quick fact about music's impact, with a graph displaying intelligence levels and famous composers.
    Free
    Add to Wishlist
    Download
    AI Customize
    Slide with a sloping bar graph in green and gray segments, three numbered points, and a text box on the right.
    Add to Wishlist
    Download
    AI Customize
    Slide showing a graph of the Dunning-Kruger Effect with stages from knowing nothing to becoming an expert with a title text.
    Add to Wishlist
    Download
    AI Customize
    Narrative arc slide displaying key plot stages with placeholder text areas.
    Add to Wishlist
    Download
    AI Customize
    Line graph slide with two data series in red and yellow, showing item based data fluctuations and a text caption.
    Add to Wishlist
    Download
    AI Customize
    Graph showing an upward curve with captions along key points, indicating growth or improvement over time.
    Add to Wishlist
    Download
    AI Customize
    A curve graph with two lines in teal and black and six labeled points, with corresponding captions on the right.
    Add to Wishlist
    Download
    AI Customize
    A collection of story arc slides featuring graphs illustrating rising action, climax, and resolution points for storytelling.
    Add to Wishlist
    Download
    AI Customize
    An S shaped curve graph with three key points, illustrating growth or change over time with captions.
    Add to Wishlist
    Download
    AI Customize
    Positively skewed histogram with blue bars, three highlighted data points, and a centered orange button at the bottom.
    Add to Wishlist
    Download
    AI Customize
    A bell curve chart slide with an orange shaded area representing percentages for standard deviations.
    Add to Wishlist
    Download
    AI Customize
    A four quadrant graph with colorful sections labeled from 01 to 04 in the center. Each quadrant has placeholder text area.