Stunning Fishbone Diagram PowerPoint And Google Slides

A fishbone diagram slide illustrating various causes for a problem, including six categories from materials to people.
P.ID : 2316
    1.8K+ views
    306 Downloads
    Get Custom Slides by Experts
    Instantly Access Templates in PowerPoint

    Fishbone Diagram Presentations Slide 

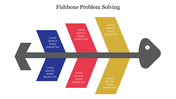
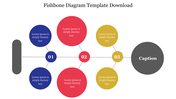
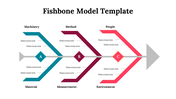
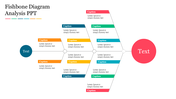
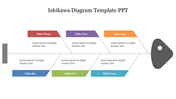
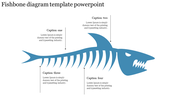
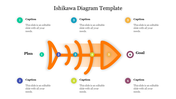
    A fishbone diagram, also known as an Ishikawa diagram or a cause-and-effect diagram, is a visual tool used to identify the root cause of a problem. The diagram takes the shape of a fishbone, with the problem at the head and the potential causes as the bones. It is a useful tool for analyzing and solving complex problems in various industries. Fishbone diagrams help teams identify the underlying causes of issues, facilitating better communication and collaboration. This template can help you enhance the message with our visually engaging template, leaving a lasting impression on your audience.


    Features of the template:

    • 100% customizable slides and easy to download.
    • The slide contained 16:9 and 4:3 formats.
    • Well-crafted template with an instant download facility.
    • Highly Compatible with PowerPoint and Google Slides.
    • This slide has a colorful design pattern.
    • Easy to change the slide's colors.


    Advertisement

    You May Also Like These PowerPoint Templates

    Add to Wishlist
    Download
    AI Customize
    Fishbone diagram with colorful arrows and segments branching from a central spine, ending in a multicolored triangular head.
    Add to Wishlist
    Download
    AI Customize
    A fishbone diagram with turquoise, yellow, and red triangular sections pointing to a gray head on a horizontal line.
    Add to Wishlist
    Download
    AI Customize
    Fishbone diagram template with categories like machinery, method, people, and environment.
    Add to Wishlist
    Download
    AI Customize
    Fishbone structure with a blue arrowhead and tail and four numbered colorful nodes along a spine on a black background.
    Add to Wishlist
    Download
    AI Customize
    Blue arrow shaped fishbone chart with vertical bars in red, green, purple, and orange showcasing percentages.
    Add to Wishlist
    Download
    AI Customize
    linear fishbone diagram slide deck with segmented bones highlighting causes and a fish head for the problem.
    Add to Wishlist
    Download
    AI Customize
    Colorful fishbone diagram with a central arrow connecting five numbered circles and labeled captions branching outward.
    Free
    Add to Wishlist
    Download
    AI Customize
    Fishbone diagram slide showing categories for identifying business problem causes with a text description.
    Add to Wishlist
    Download
    AI Customize
    Template featuring a red fishbone diagram with placeholder text areas for causes and effects in a white backdrop.
    Add to Wishlist
    Download
    AI Customize
    Fishbone diagram PowerPoint slide with sections for the plan, position, pattern, and ploy with placeholder text.
    Add to Wishlist
    Download
    AI Customize
    Fishbone diagram PowerPoint slide showing four steps  each connected by colored arrows and containing short descriptions.
    Add to Wishlist
    Download
    AI Customize
    Fishbone diagram with colored nodes and text captions illustrating causes and their relationship to a central outcome.
    Add to Wishlist
    Download
    AI Customize
    Ishikawa fishbone diagram slide illustrating potential causes with captions.
    Add to Wishlist
    Download
    AI Customize
    Fishbone diagram in orange layout highlighting four key categories with captions areas and nodes.
    Free
    Add to Wishlist
    Download
    AI Customize
    A fishbone diagram with a red head and multiple branching lines with seven captions displayed on a light beige background.
    Add to Wishlist
    Download
    AI Customize
    Download Unlimited Fishbone Diagram Template Slide PPT
    Free
    Add to Wishlist
    Download
    AI Customize
    Fishbone diagram template featuring a red fishbone shows the effect and causes, each labelled with a caption areas.
    Add to Wishlist
    Download
    AI Customize
    Slide featuring a fishbone diagram with categories from financial to manufacturing and their respective effects.