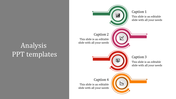
Free - Effective Business Analysis Presentation Template Design

Free
Business analysis layout with six titled green and teal blocks, pointing towards captions along a central black arrow.
P.ID : 5919
    2.5K+ views
    682 Downloads
    Get Custom Slides by Experts
    Instantly Access Templates in PowerPoint

    Mind-Blowing Business Presentation Slides


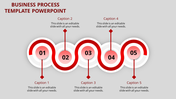
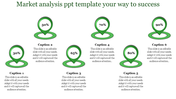
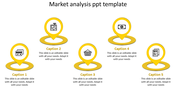
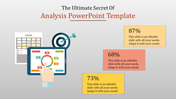
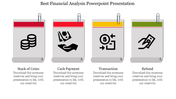
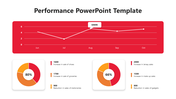
    Business Analysis Presentation Templates are the ultimate solution for businesses aiming to deliver complex data and ideas to stakeholders in a captivating and engaging manner. The pre-designed, customizable slides provide a wide array of choices to create impactful and informative presentations. By leveraging these templates, businesses can highlight the critical aspects of their analysis, enabling stakeholders to quickly grasp the presented information. With our Business Analysis Presentation Templates, you can confidently deliver powerful presentations that effectively communicate insights and recommendations, leaving their stakeholders inspired and informed.

    Features of this template

    • 100% customizable slides and easy to download
    • Slides are available in different nodes & colors.
    • The slides contain 16:9 and 4:3 formats.
    • Easy to change the slide colors quickly.
    • Well-crafted template with an instant download facility.
    • Give a click and reap benefits.
    • Multifarious designs are used.
    • Open on google slides.
    Advertisement

    You May Also Like These PowerPoint Templates

    Add to Wishlist
    Download
    AI Customize
    Six pie analysis charts in blue, red, orange, green, teal, and purple, displaying percentages from 15% to 90%.
    Add to Wishlist
    Download
    AI Customize
    Linear timeline showing red triangular nodes connected by dots, each node containing an icon and caption.
    Add to Wishlist
    Download
    AI Customize
    Attractive Business Analytics PowerPoint Template Design
    Add to Wishlist
    Download
    AI Customize
    A person working on a laptop with analysis data, alongside bar charts with percentage and text box, on a gray background.
    Add to Wishlist
    Download
    AI Customize
    Analytics slide with line graph, pie chart, and statistics showing 13M views, 13M active subscribers, and 991K subscribers.
    Free
    Add to Wishlist
    Download
    AI Customize
    Best Scenario Analysis Presentation Template Slides
    Add to Wishlist
    Download
    AI Customize
    Analysis presentation slide showing a technology growth chart with percentage values and icons with placeholder text.
    Add to Wishlist
    Download
    AI Customize
    Analysis PPT slide with four colorful text boxes and unique icons for each stage of the process with captions.
    Add to Wishlist
    Download
    AI Customize
    Yellow pie chart divided into Analysis 1, 2, and 3 segments, focused by a black magnifying glass icon.
    Add to Wishlist
    Download
    AI Customize
    Graph with three numbered curves in green, orange, and red, with corresponding text on the right.
    Free
    Add to Wishlist
    Download
    AI Customize
    Blue themed slide with two square icons on tilted diamonds and two rectangular caption boxes on the right.
    Free
    Add to Wishlist
    Download
    AI Customize
    Analysis PPT slide showing a phone with a checklist and icons with multiple captions with text descriptions.
    Free
    Add to Wishlist
    Download
    AI Customize
    Four triangular icons in yellow, pink, purple, and red, showing percentages, with gray caption boxes below.
    Add to Wishlist
    Download
    AI Customize
    Slide featuring a five step process for performance with matching icons for each phase.
    Free
    Add to Wishlist
    Download
    AI Customize
    Analysis presentation template with six sections arranged in a yellow circle, each featuring an icon and caption.
    Add to Wishlist
    Download
    AI Customize
    Analysis PowerPoint slide featuring a hexagonal internal analysis core and six colorful surrounding icons with labels.
    Add to Wishlist
    Download
    AI Customize
    Colorful pie chart with a man holding a pencil, surrounded by directional arrows, symbolizing analysis and decision making.