Free - Environment Kpis Dashboard — Your Metrics, Instantly Readable

Free
Energy, transport, and waste emissions, water usage, greenhouse gases, and departmental CO₂ stats tracked.
P.ID : 74434
    1K+ views
    220 Downloads
    Get Custom Slides by Experts
    Enhance Your Presentations with Add-ins
    Google Slides Add-in
    Access templates directly in Google Slides
    Microsoft PowerPoint Add-in
    Access templates directly in PowerPoint
    GPT Add-on
    AI-powered presentation assistance

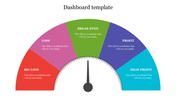
    Environment Kpis Dashboard — PowerPoint, Google Slides, and Canva Template


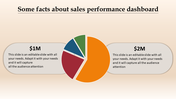
    Dashboards packed with raw numbers lose the room. A structured visual layout guides attention to the metrics that matter — and makes decisions easier.


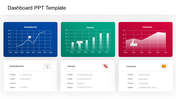
    This Environment KPIs Dashboard gives you a clean, fully editable presentation slide that's ready to use the moment you download it. The slide features energy, transport, and waste emissions, water usage, greenhouse gases, and departmental CO₂ stats tracked. Drop it into your deck, replace the placeholder text, and you're done.


    What's Inside


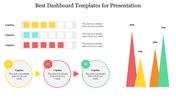
    A focused single-slide design — built for one strong visual message, fast to customize — text, colors, icons, and layout are all yours to adjust. Design variations include: Environment KPIs Dashboard, Environment, KPIs Dashboard, Dashboard. Match your brand, adapt the layout, change the colors — it takes minutes, not hours.


    Who This Is For


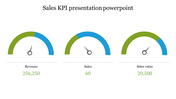
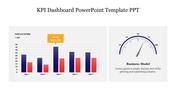
    Built for analysts, business intelligence teams, executives, and managers presenting performance data in a clear, visual format. No design background needed — just open, edit, and present.


    Formats & Download


    Available for PowerPoint, Google Slides, and Canva. Download free — no account needed. Open it in your preferred app and start editing right away.


    Key Features


    • Fully editable — text, colors, icons, and layout
    • Compatible with PowerPoint, Google Slides, and Canva
    • 16:9 widescreen format — presentation-ready
    • Clean, professional design — no clutter
    • Free — instant download access

    Explore more Environmental slide designs to find the right fit for your next presentation.


    Related collections: Market analysis templates | Business plan templates

    Advertisement

    You May Also Like These PowerPoint Templates

    Add to Wishlist
    Download
    AI Customize
    Dashboard template with a world map showing highlighted regions, bar graphs, and financial data captions.
    Add to Wishlist
    Download
    AI Customize
    Circular tachometer gauge with a needle pointing six colored sections, and captions in rounded rectangles connected by lines.
    Add to Wishlist
    Download
    AI Customize
    Project summary dashboard showing project statistics, budget, actual performance, and project performance by category.
    Add to Wishlist
    Download
    AI Customize
    KPI themed slide with data visualization including pie charts, bar graphs, line graphs, and key metrics.
    Free
    Add to Wishlist
    Download
    AI Customize
    Five-level bar chart executive dashboard with colored blocks labeled with five levels, showing a gradual progression.
    Add to Wishlist
    Download
    AI Customize
    KPI dashboard template PowerPoint slide featuring three sections for data visualization.
    Add to Wishlist
    Download
    AI Customize
    Logistics performance dashboard with two circular charts for failure distribution and delivery tracking, and a gauge meter.
    Add to Wishlist
    Download
    AI Customize
    Add to Wishlist
    Download
    AI Customize
    Project management dashboard with bar charts, numerical data panels, and color-coded sections.
    Add to Wishlist
    Download
    AI Customize
    Slide with a businesswoman standing beside a colorful ring chart labeled on a board and four captions on the right.
    Add to Wishlist
    Download
    AI Customize
    Project dashboard slides with Gantt chart, a burndown chart, and a timeline, using a palette of brown, green, and red.
    Add to Wishlist
    Download
    AI Customize
    Four colored circular progress, one is higlighted in a box with a pie chart, and a bar chart labelled with sections.
    Add to Wishlist
    Download
    AI Customize
    KPI dashboard template with six sections which includes charts, graphs, and numerical data.
    Free
    Add to Wishlist
    Download
    AI Customize
    Add to Wishlist
    Download
    AI Customize
    Tachometer slide with four gauges in orange, red, blue, and green, each with captions below describing different readings.
    Add to Wishlist
    Download
    AI Customize
    KPI slide with four semi circular gauges displaying metrics and overlapping colored circles showing numerical data.