Data Center PowerPoint Presentation Template Five Node

A data center slide featuring an illustration of a server rack at the center, with percentage indicators for data metrics.
P.ID : 25554
    148 views
    7 Downloads
    Get Custom Slides by Experts
    Instantly Access Templates in PowerPoint

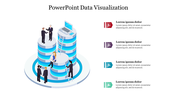
    Customizable Data Center Presentation Template

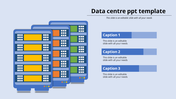
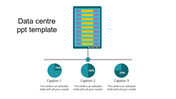
    Captivate your audience with our Data Center PowerPoint Template. This template includes easy-to-understand diagrams and pre-formatted sections to visually represent your data center infrastructure, security measures, and technological advancements. This versatile template is a valuable tool for anyone who needs to communicate data center concepts effectively.

    IT professionals can leverage it to present to clients or colleagues, educators can use it to explain data center functions to students, and business leaders can employ it to secure funding for data center upgrades. The template's clean design and editable elements allow for easy customization to fit your specific needs. Download and Explore these templates with Google Slides Themes Today!

    Features of the template:

    •  Slides are available in 4:3 & 16:9
    • Well-crafted template with instant download.
    • Get slides that are 100% customizable and easy to download
    Advertisement

    You May Also Like These PowerPoint Templates

    Add to Wishlist
    Download
    AI Customize
    Folder icon with a magnifying glass on the left, alongside four numbered circles with descriptions in a beige theme.
    Add to Wishlist
    Download
    AI Customize
    Isometric illustration of data servers, a laptop, and businesspeople with text about data visualization on the left.
    Add to Wishlist
    Download
    AI Customize
    Big Data slide shows a quadrant with complexity versus business value, highlighting predictive analytics on a dark backdrop.
    Add to Wishlist
    Download
    AI Customize
    Big data slide showcasing sectors with healthcare, science, security, and business with adaptation notes with icons.
    Add to Wishlist
    Download
    AI Customize
    Dark themed slide with five teal outlined boxes containing icons and descriptions about big data benefits.
    Free
    Add to Wishlist
    Download
    AI Customize
    Big data layout with connected pathways from data storage to various output applications and platforms.
    Add to Wishlist
    Download
    AI Customize
    PowerPoint slide showing a data center graphic with pie charts representing different percentages and captions.
    Add to Wishlist
    Download
    AI Customize
    Collection of slides focused on privacy and big data, showcasing colorful charts, icons, and textual descriptions.
    Add to Wishlist
    Download
    AI Customize
    Big data infographics slide deck with various visualization elements like charts, graphs, and icons in colorful layouts.
    Add to Wishlist
    Download
    AI Customize
    Infographic with a server icon linked to four pie charts in blue, each with captions and percentage labels.
    Add to Wishlist
    Download
    AI Customize
    10Vs of Big Data slide detailing from value to variety with color coded icons and text description.
    Add to Wishlist
    Download
    AI Customize
    10Vs of Big Data diagram PPT slide highlighting key concepts in color coded icons with definitions for each.
    Add to Wishlist
    Download
    AI Customize
    Big data slide with ten colored circles containing icons, paired with brief descriptions in a stacked design.
    Add to Wishlist
    Download
    AI Customize
    Big data slide with a modern design, including two digital network icons and text about social media profile analysis.
    Add to Wishlist
    Download
    AI Customize
    Editable 10Vs Of Big Data PowerPoint And Google Slides
    Add to Wishlist
    Download
    AI Customize
    Big data layout featuring a navy blue sidebar and three column diagrams illustrating data and warehouse options in grayscale.
    Free
    Add to Wishlist
    Download
    AI Customize
    Big data slide with two bar graphs showing company revenue and revenue forecast, with headings and arrows indicating growth.