MILESTONE 🌟 5 Million+ creative minds trust SlideEgg! Grab 80% OFF

Easy To Editable Dashboard PowerPoint And Canva Templates

Dashboard slide with income line chart, 3D pie chart, stacked bars by category, and area revenue timeline graph.
P.ID : 9002
    194 views
    4 Downloads
    Get Custom Slides by Experts
    Instantly Access Templates in PowerPoint

    Dashboard PowerPoint, Google Slides, and Canva Template

    Dashboard tools have become essential in today’s data-driven world, offering a centralized view of performance metrics, analytics, and decision-making insights. Whether used for KPI tracking, business reporting, or executive summaries, dashboards help professionals turn complex data into easy-to-read visual formats. With the rise of cloud-based business intelligence and real-time analytics, dashboards play a critical role in improving transparency, operational efficiency, and strategic planning. This deck is designed to help teams, educators, and analysts present data insights with clarity and visual impact.

    Purpose Of The Slides

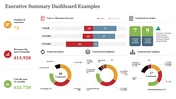
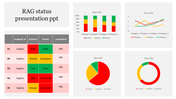
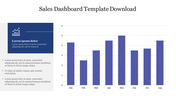
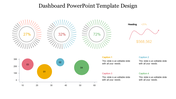
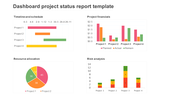
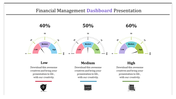
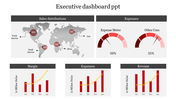
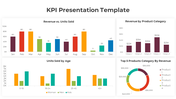
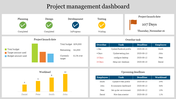
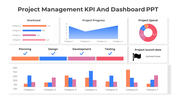
    This Dashboard provides a visual framework for presenting performance metrics, tracking goals, or reporting results. It’s ideal for showcasing analytics across departments like marketing, sales, finance, or operations. Each layout is carefully designed to enhance storytelling through data.


    Who Can Use It?

    Perfect for data analysts, project managers, executives, students in business or IT, and educators. Whether you're leading a corporate review, teaching data literacy, or pitching insights to stakeholders, this deck supports you with a professional layout.


    Special Key Features

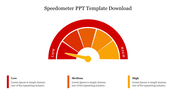
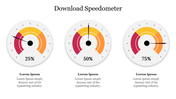
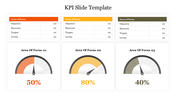
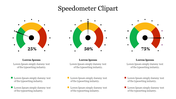
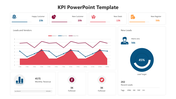
    The single slide includes vibrant, multicolor infographics, data widgets, chart placeholders, and clean layouts for effective visualization. Each slide is fully customizable and designed for drag-and-drop editing. Optimized for dashboard presentations.


    Features of this template

    • 100% customizable slides and easy to download.
    • The slides contain 16:9 and 4:3 formats.
    • Easy to change the colors quickly.
    • Highly compatible with PowerPoint, Google Slides, and Canva templates.
    Advertisement

    You May Also Like These PowerPoint Templates

    Add to Wishlist
    Download
    AI Customize
    Project management dashboard with charts for budget, progress, risks, workload, and projected launch date and icons.
    Add to Wishlist
    Download
    AI Customize
    PowerPoint slide with KPI dashboard metrics, including revenue, sales by month, and customer revenue comparison.
    Free
    Add to Wishlist
    Download
    AI Customize
    KPI Dashboard with bubbles for sales, attendance, download, and report and a client location legend.
    Add to Wishlist
    Download
    AI Customize
    KPI Training slide featuring a social media analysis table with metrics for followers, mentions, interactions, and shares.
    Add to Wishlist
    Download
    AI Customize
    Task management dashboard slide showing task numbers and completion percentages with colored gauge icons.
    Add to Wishlist
    Download
    AI Customize
    Revenue dashboard with bar charts, statistics, and sliders showing data metrics in various colors.
    Add to Wishlist
    Download
    AI Customize
    Editable Speedometer PowerPoint Template Presentation
    Add to Wishlist
    Download
    AI Customize
    Color coded executive dashboard slide displaying a timeline of tasks, various sections, and charts.
    Add to Wishlist
    Download
    AI Customize
    Slide featuring a colorful tachometer diagram explaining its components, functionality, and usage with icons.
    Add to Wishlist
    Download
    AI Customize
    RAG dashboard with red, yellow, and green sections showing project status, using bar, line, and pie charts.
    Free
    Add to Wishlist
    Download
    AI Customize
    Automotive Dashboard PPT Presentation and Google Slides
    Add to Wishlist
    Download
    AI Customize
    Easily Editable Progress Dashboard Template
    Add to Wishlist
    Download
    AI Customize
    Circular dashboard graphic with five colored sections labeled surrounding a central gauge with a red needle.
    Add to Wishlist
    Download
    AI Customize
    Credit score meter with a needle in the center, displaying risk levels on a gradient from yellow to blue with caption areas.
    Free
    Add to Wishlist
    Download
    AI Customize
    Two speedometers with red and purple needle pointers, with caption and corresponding colored dots below.
    Add to Wishlist
    Download
    AI Customize
    3D sales chart displaying a 60 percent sales progress with an informative text section and interactive button on blue theme.
    Add to Wishlist
    Download
    AI Customize
    Dashboard template displaying a project timeline with a Gantt chart, project details, and phases from initiation to closure.
    Add to Wishlist
    Download
    AI Customize
    Sales report slide showing metrics like sales volume, profit margin, and a gauge chart along with a bar graph.