A SaaS pitch deck is a 10–15 slide presentation that proves a subscription software business can grow predictably—built around recurring-revenue metrics like MRR, ARR, churn, and net revenue retention rather than a one-time sales story. Raising money for SaaS is a different game than pitching a physical product or a services business: investors aren’t just backing an idea, they’re underwriting a repeatable, scalable revenue engine. This guide covers the exact slide structure, the metrics that carry weight in 2026, the design rules that make a deck land, and the templates you can start from.
A generic startup deck earns a polite “thanks, we’ll pass.” A SaaS-specific deck, built around the metrics and slide order investors expect, earns a second meeting. Here’s how to build one.
Why SaaS Pitch Decks Need Their Own Playbook
Every pitch deck answers four questions fast: what’s the problem, what’s the solution, how big is the market, and why you? A SaaS deck answers those same four, but it also has to prove something extra—that your revenue compounds. Investors in subscription businesses are underwriting a multi-year annuity, not a one-time sale, so the deck needs to show growth velocity and retention just as clearly as the product story.
This is why industry context shapes deck design. A pharma deck needs clinical-trial timelines. A real-estate deck needs cap-rate tables. A SaaS deck needs MRR/ARR growth curves and churn metrics front and center—not buried in an appendix.
The Core Slide Structure for a SaaS Pitch Deck
Start from the classic 10-slide framework popularized by Guy Kawasaki, then adapt each slide for a subscription business model. The table below maps the 12 core slides to what an investor is actually looking for on each one.
| # | Slide | What investors look for |
|---|---|---|
| 1 | Cover / Title | Company name, a one-line value proposition, and contact details—clarity in the first three seconds. |
| 2 | The Problem | A specific, painful workflow or cost, quantified with a real number or a short customer anecdote. |
| 3 | The Solution | Why your product is meaningfully better than the status quo—including “do nothing” or a spreadsheet. |
| 4 | Product Demo / How It Works | Real screenshots or a simple flow diagram. Investors want to see the product, not just read about it. |
| 5 | Market Size (TAM / SAM / SOM) | A bottom-up figure framed around your vertical or use case—not the entire global software market. |
| 6 | Business Model & Pricing | Subscription tiers, per-seat vs. usage-based pricing, and your average contract value. |
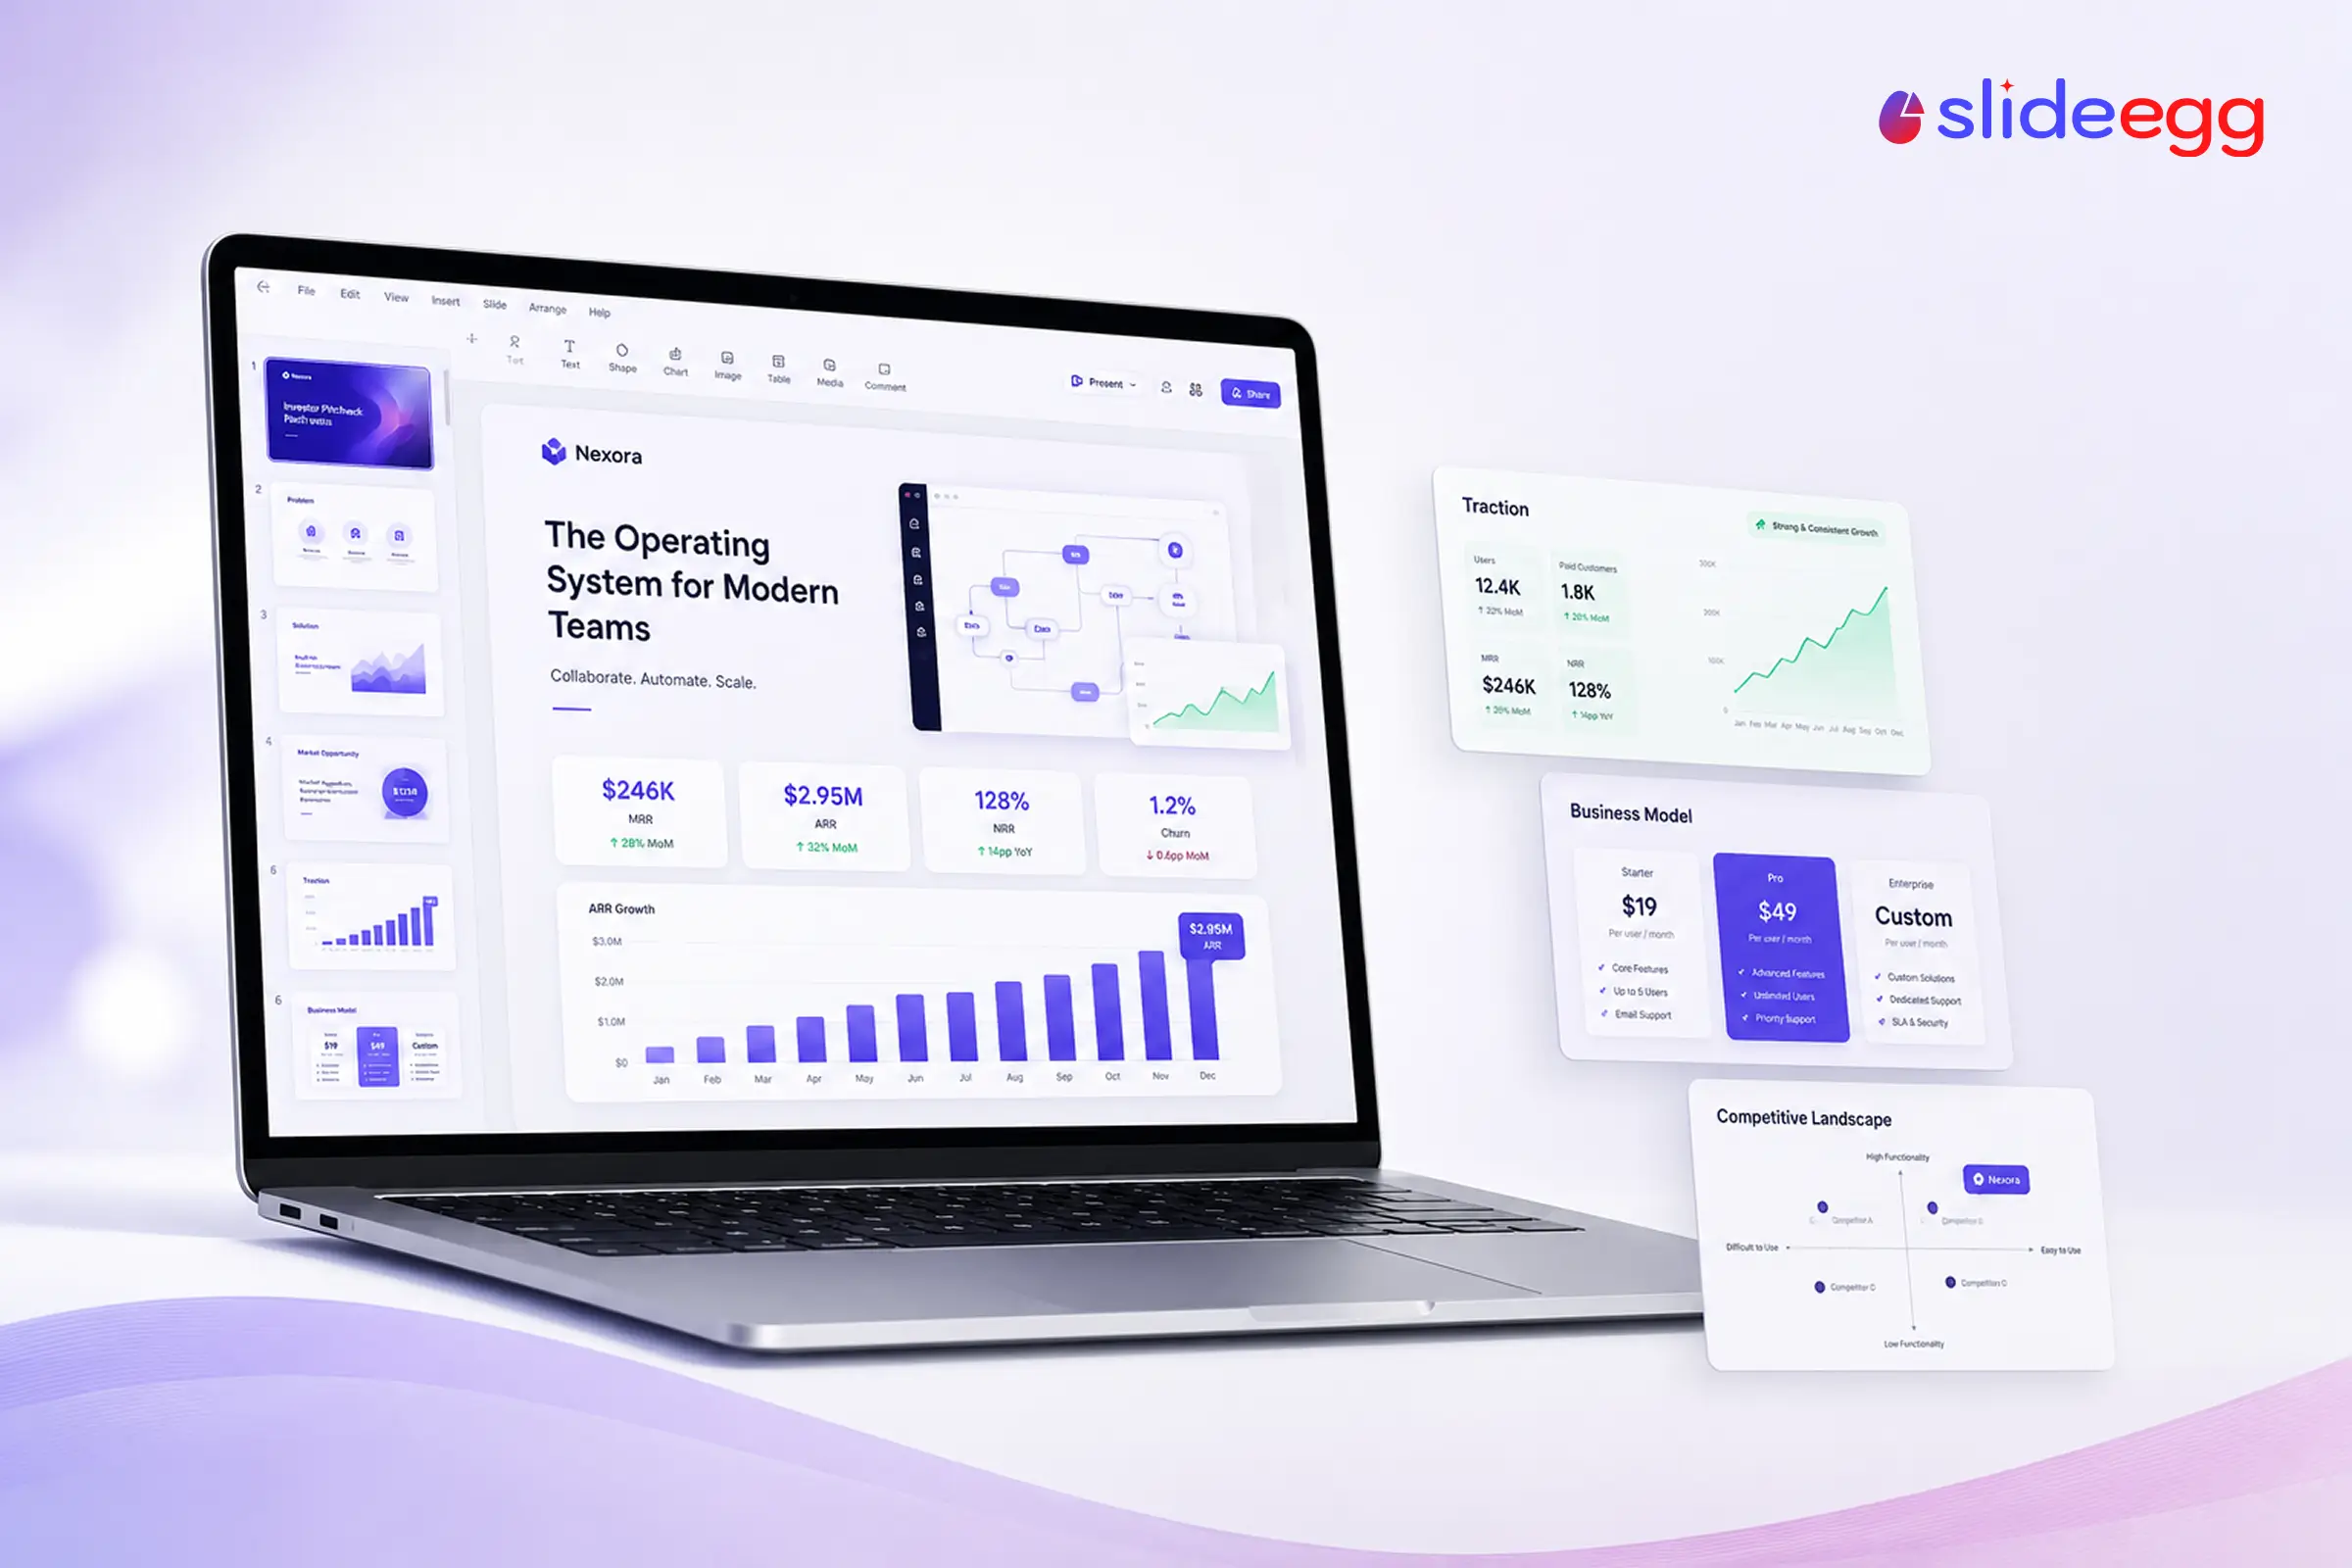
| 7 | Traction & SaaS Metrics | The slide that makes or breaks the deck: MRR/ARR growth, logo count, net revenue retention, and churn. |
| 8 | Go-to-Market Strategy | Your channels, sales motion (self-serve vs. sales-led), and customer acquisition cost. |
| 9 | Competitive Landscape | A 2×2 matrix or feature table showing differentiation against direct and adjacent competitors. |
| 10 | Team | Why your specific team can execute in this market. |
| 11 | Financials & Projections | A 3-year forecast built on real cohort data, not just top-down market assumptions. |
| 12 | The Ask | How much you’re raising, at what valuation, and the milestone it funds (e.g., “18 months of runway to hit $2M ARR”). |
The SaaS Metrics Slide: What Actually Belongs There
This is the slide generic pitch deck templates get wrong most often. For a SaaS traction slide, prioritize:
- MRR/ARR growth curve — month-over-month, ideally showing an accelerating trend line.
- Net Revenue Retention (NRR) — 100% is break-even; expansion has to outpace churn to clear it. The median for venture-backed SaaS sits around 106%, so treat 110%+ as healthy and 120%+ as premium territory. “Just above 100%” reads as thin to a 2026 investor.
- Logo retention / churn rate — investors will ask even if you leave it off, so show it first.
- CAC and LTV:CAC ratio — 3:1 is the minimum floor investors expect, not the goal. Strong B2B SaaS aims for 4:1 or higher; below 1:1 means you lose money on every customer acquired.
- Sales cycle length and average contract value (ACV) — especially important if you’re moving from self-serve toward enterprise sales.
If you’re raising a Series A or later round, expect investors to dig into cohort retention charts and unit economics in more depth than at seed. Have backup slides ready even if the main deck stays lean.
Design Principles That Make SaaS Decks Land
Headlines should be conclusions, not labels. “ARR grew 4× in 12 months” is a headline. “Revenue Chart” is not. Every slide title should state the takeaway an investor should remember.
- One idea per slide. Dense, multi-metric slides slow investors down—and they’re skimming, not studying.
- Consistent visual system. Charts, icons, and color palette should look like one deck, not four stapled together.
- Real product screenshots over stock photography. Investors want proof the product exists and works.
- Keep it to 10–15 slides. Detailed cohort tables, technical architecture, and hiring plans belong in an appendix, not the core narrative.
Where to Start: Templates You Can Customize
Rather than building slide logic from a blank page, it’s faster to start from a pre-built structure and swap in your own numbers and story. SlideEgg’s pitch deck template collection has 170+ free and premium options for PowerPoint, Google Slides, and Canva—including layouts built around investor pitch structures, startup fundraising, and financial projections, all of which map cleanly onto the SaaS outline above.
A few specific templates worth starting from:
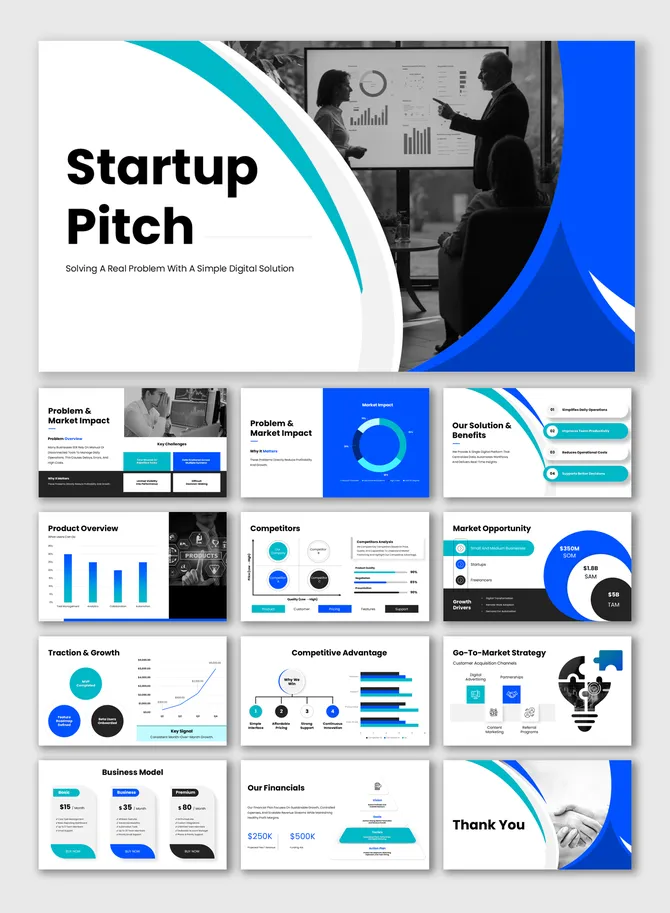
- Startup Pitch Deck Template — a clean structure for early-stage SaaS companies raising a first round.
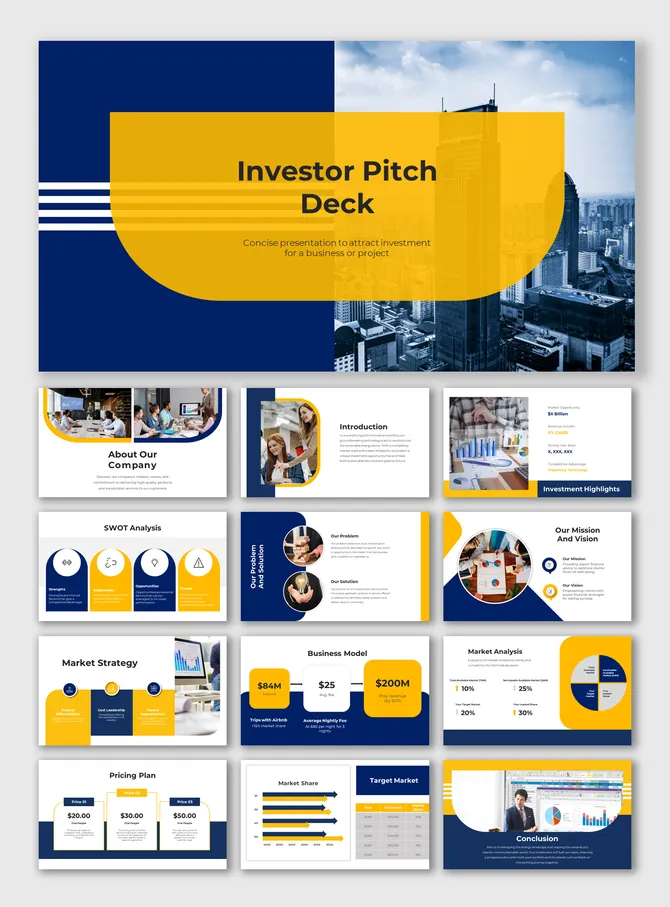
- Investor Pitch Deck Template — for later-stage rounds where investors expect more financial depth.
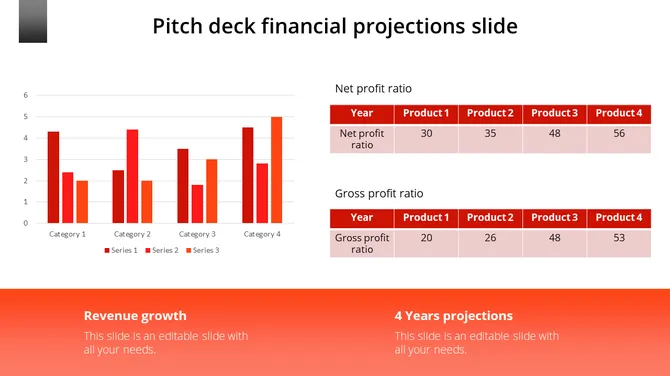
- Pitch Deck Financial Projections Slide — a ready-made layout for your 3-year revenue forecast.
- Business Model Slide — for laying out subscription tiers and pricing clearly.
- Market Validation Slide — helpful for the traction and validation section.
Start from a proven structure instead of a blank slide.
Editable in PowerPoint, Google Slides, and Canva—plug in your metrics and story.
Browse SaaS Pitch Deck Templates
Related Guides
If you’re building your deck from scratch, these go deeper on adjacent decisions:
- 10-Slide Pitch Deck vs. 22-Slide Pitch Deck: Which Should You Use?
- Seed Round vs. Series A Pitch Deck: Key Differences
- How to Design a Business Pitch Deck That Wins Investors
- How to Use AI to Design Pitch Decks
Frequently Asked Questions About SaaS Pitch Decks
What is a SaaS pitch deck?
A SaaS pitch deck is a 10–15 slide presentation that explains a subscription software business to investors. It covers the problem, the product, market size, business model, and—critically—recurring-revenue metrics like MRR, ARR, and churn that show the business can scale predictably.
How many slides should a SaaS pitch deck have?
Most SaaS pitch decks run 10 to 15 slides for the core investor narrative. Seed-stage decks tend toward the shorter end (10–12 slides); Series A and later decks often run 12–15 to make room for deeper unit economics and cohort data. Supporting detail belongs in an appendix, not the main deck.
What makes a SaaS pitch deck different from a regular startup pitch deck?
A SaaS deck puts recurring-revenue metrics—MRR/ARR growth, net revenue retention, churn, and LTV:CAC—front and center, usually on a dedicated traction slide. A generic startup deck may reference revenue in passing; a SaaS deck treats it as the central proof point because investors are underwriting a multi-year revenue stream, not a one-time sale.
What metrics should be on a SaaS traction slide?
The essentials are MRR or ARR growth over time, net revenue retention (NRR), logo/customer churn rate, customer acquisition cost (CAC), and the LTV:CAC ratio. For NRR, the venture-backed median is around 106%, so aim to clear 110%. For LTV:CAC, 3:1 is the floor and 4:1+ is the target for B2B SaaS. Sales cycle length and average contract value (ACV) are useful additions for B2B.
What is a good LTV:CAC ratio for a SaaS pitch deck?
In 2026, a 3:1 LTV:CAC ratio is the minimum viable threshold, not the benchmark to aim for—strong B2B SaaS companies target 4:1 or higher, meaning a customer’s lifetime value is at least four times what it costs to acquire them. A ratio below 1:1 signals you lose money on every customer, which investors flag immediately.
What is a good net revenue retention rate for a SaaS deck?
NRR of 100% means expansion revenue exactly offsets churn. The median for venture-backed SaaS is roughly 106%, so 110%+ reads as healthy and 120%+ puts you in premium-multiple territory. Showing NRR comfortably above 100% is one of the strongest signals a SaaS deck can carry.
What’s the difference between MRR and ARR in a pitch deck?
MRR (Monthly Recurring Revenue) is your predictable revenue on a monthly basis; ARR (Annual Recurring Revenue) is MRR multiplied by 12. Early-stage decks often lead with MRR growth since month-over-month movement is more visible at smaller scale, while later-stage decks typically report ARR.
Should a SaaS pitch deck include pricing details?
Yes. A business model slide should show your pricing tiers, whether you charge per seat or by usage, and your average contract value. Investors use this to sanity-check your revenue projections and understand how pricing scales as you move upmarket.
How is a seed-stage SaaS pitch deck different from a Series A deck?
A seed-stage deck focuses on problem-solution fit, early traction, and founding-team strength, often with limited revenue history. A Series A deck needs sustained MRR/ARR growth, cohort retention data, and a repeatable go-to-market motion—investors expect quantified proof the model works, not just a promising early signal.
What should the “ask” slide include in a SaaS pitch deck?
The ask slide should state exactly how much you’re raising, at what valuation (or range), and the specific milestone the funding reaches—for example, “$1.5M to reach $2M ARR within 18 months.” Vague asks without a milestone are a common reason decks stall in follow-up.
Can I build a SaaS pitch deck without a designer?
Yes. Pre-built, editable templates in PowerPoint, Google Slides, or Canva let you swap in your own numbers, screenshots, and branding without building slide layout from scratch—usually faster and more consistent than designing each slide manually. SlideEgg offers 170+ editable pitch deck templates across all three formats: browse the free and premium collection here.
What are common mistakes in SaaS pitch decks?
The most frequent are burying churn or retention numbers instead of leading with them, using vanity metrics (like total signups) instead of revenue-based ones, overcrowding slides with multiple charts, and failing to tie the funding ask to a specific, measurable milestone.
Do investors expect different pitch decks for self-serve vs. sales-led SaaS?
Yes, at least on the go-to-market slide. Self-serve decks emphasize product-led metrics like signup-to-paid conversion and time-to-value. Sales-led decks emphasize sales cycle length, average contract value, and pipeline velocity. The rest of the deck structure stays largely the same.
What tools can I use to make a SaaS pitch deck?
PowerPoint, Google Slides, and Canva are the three most common, and most professional templates come in all three formats. Choose based on collaboration needs—Google Slides for real-time editing with co-founders, Canva for quick brand customization, PowerPoint for offline editing and PDF export.
Conclusion
A great SaaS pitch deck isn’t about flashy design—it’s about proving, slide by slide, that your revenue engine works and compounds. Lead with the problem, prove traction with real SaaS metrics benchmarked to 2026 expectations, and close with a clear, specific ask. Start from a proven template structure, plug in your actual numbers, and you’ll spend your prep time refining the story instead of building slide logic from scratch.