Best Big Data Presentation Template Slide With Graph

Big Data slide shows a quadrant with complexity versus business value, highlighting predictive analytics on a dark backdrop.
P.ID : 32666
    388 views
    17 Downloads
    Get Custom Slides by Experts
    Instantly Access Templates in PowerPoint

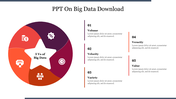
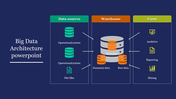
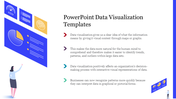
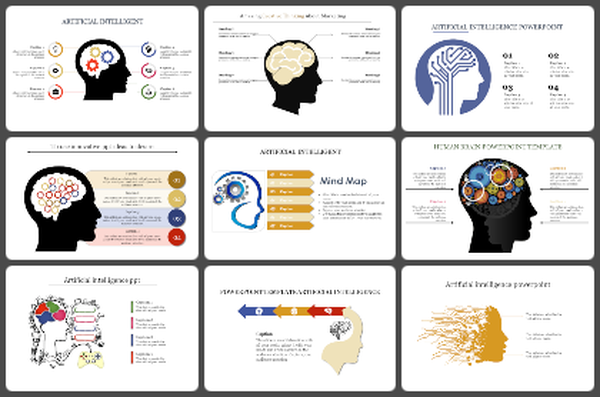
    Two-Noded Big Data Presentation Template 


    Download this Big Data Presentation Template to present any data sets in a fresh new way. You can use this best template to convey your data in a way that your audiences will understand and respond to. It is very attractive and has many features that make it very easy to use. It is a great alternative to more elaborate and more complicated PowerPoint presentations. 

    About the template:

    The Big Data Presentation Template is an excellent tool for data visualization. It has a dark background which will clearly pop up the white-colored graph and text. It also has well-researched text that will minimize your work while making an effective presentation. Using this two-noded template, you can perfectly present your data, which can be easily understood by your audience. You can adjust the layout, color, and appearance to create a highly adaptable presentation. 

    Features of this template:

    1. 100% customizable slides and easy to download.
    2. Slides available in different nodes & colors.
    3. The slide contained 16:9 and 4:3 format.
    4. Easy to change the slide colors quickly.
    5. Well-crafted template with instant download facility.
    6. An outstanding template to present the big data.
    Advertisement

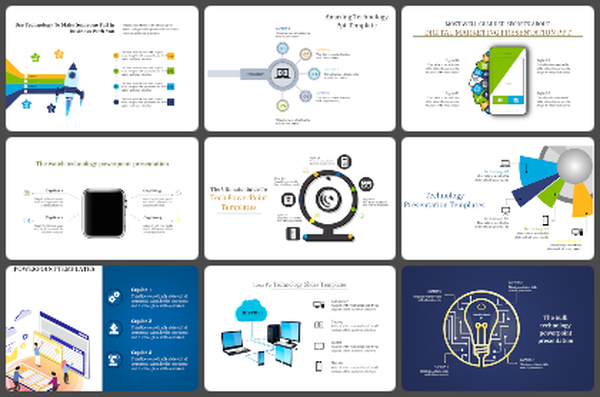
    You May Also Like These PowerPoint Templates

    Add to Wishlist
    Download
    AI Customize
    3D layered data visualization with business people interacting, laptops on top, and numbered text sections on the side.
    Add to Wishlist
    Download
    AI Customize
    Infographic illustrating the four key dimensions of Big Data with associated definitions and icons.
    Add to Wishlist
    Download
    AI Customize
    Big data architecture diagram showing a flow from data ingestion, staging, and access to insights, with components.
    Free
    Add to Wishlist
    Download
    AI Customize
    Three stacked cylinder diagrams in green and purple, connected by arrows to a central circle, set against a gray background.
    Add to Wishlist
    Download
    AI Customize
    Big data-related slide with four icons and progress bars on the left, and a percentage-based bar graph on the right.
    Add to Wishlist
    Download
    AI Customize
    Three teal outlined rectangular boxes featuring data visualization illustations in blue theme and bullet points below.
    Add to Wishlist
    Download
    AI Customize
    A teal server icon at the top with yellow and pink details, connected to three pie charts labeled below.
    Add to Wishlist
    Download
    AI Customize
    Folder icon with a magnifying glass on the left, alongside four numbered circles with descriptions in a beige theme.
    Add to Wishlist
    Download
    AI Customize
    Isometric illustration of data servers, a laptop, and businesspeople with text about data visualization on the left.
    Add to Wishlist
    Download
    AI Customize
    Big Data slide shows a quadrant with complexity versus business value, highlighting predictive analytics on a dark backdrop.
    Add to Wishlist
    Download
    AI Customize
    Big data slide showcasing sectors with healthcare, science, security, and business with adaptation notes with icons.
    Add to Wishlist
    Download
    AI Customize
    Dark themed slide with five teal outlined boxes containing icons and descriptions about big data benefits.
    Free
    Add to Wishlist
    Download
    AI Customize
    Big data layout with connected pathways from data storage to various output applications and platforms.
    Add to Wishlist
    Download
    AI Customize
    PowerPoint slide showing a data center graphic with pie charts representing different percentages and captions.
    Add to Wishlist
    Download
    AI Customize
    Collection of slides focused on privacy and big data, showcasing colorful charts, icons, and textual descriptions.
    Add to Wishlist
    Download
    AI Customize
    Big data infographics slide deck with various visualization elements like charts, graphs, and icons in colorful layouts.
    Add to Wishlist
    Download
    AI Customize
    Infographic with a server icon linked to four pie charts in blue, each with captions and percentage labels.
    Add to Wishlist
    Download
    AI Customize
    10Vs of Big Data slide detailing from value to variety with color coded icons and text description.
    Add to Wishlist
    Download
    AI Customize
    10Vs of Big Data diagram PPT slide highlighting key concepts in color coded icons with definitions for each.