Best This Vs That PowerPoint And Google Slides Templates

Pack of 11 slides
P.ID : 72218
Advertisement
550 views
119 Downloads
Get Custom Slides by Experts
Instantly Access Templates in PowerPoint

Innovative This Vs That Presentation Slides


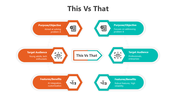
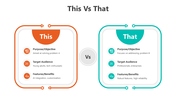
Navigating through choices can be daunting, whether in business, education, or personal decisions. "This Vs That" is a versatile concept that simplifies comparisons, enabling you to weigh options clearly and make informed decisions. This approach fosters clarity by juxtaposing two alternatives, highlighting their pros and cons in a direct and understandable manner.

It's an invaluable tool for anyone needing to present comparative data or decisions in any field. Engage with this method to transform complex decisions into straightforward, binary choices that are easier for your audience to grasp and act upon. This PowerPoint template is ideal for educators, marketers, business analysts, and decision-makers who frequently assess and compare different options. By using

This template, you can effectively communicate the advantages and disadvantages of two competing choices, products, strategies, or ideas. The slides are designed to be fully editable, allowing you to tailor your presentation to your specific needs.

As a presenter, you'll benefit from the ability to clearly articulate comparisons, making your presentations more impactful and your arguments more persuasive.  Take advantage of this template to elevate your presentations and guide your audience towards making well-informed choices. Ready to enhance your comparative presentations? Try this template today and empower your audience with clear, comparative insights!

Features of this templates


  • 100% customizable slides and easy to download.
  • The slide contains 16:9 and 4:3 formats.
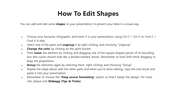
  • Easy to change the colors of the slide quickly.
  • Highly compatible with PowerPoint and Google Slides.

You May Also Like These PowerPoint Templates

Add to Wishlist
Download
AI Customize
Comparison layout with two gray batteries, featuring red and teal levels showing different percentages on a dark backdrop.
Add to Wishlist
Download
AI Customize
Easy To Editable Compare PowerPoint And Google Slides
Free
Add to Wishlist
Download
AI Customize
Green circular sections connected to a central icon, with three numbered circles on both sides and text.
Free
Add to Wishlist
Download
AI Customize
Red cause-and-effect layout with wavy lines connecting two columns, each having three sections, with placeholder text.
Free
Add to Wishlist
Download
AI Customize
Orange themed cause and effect diagram PowerPoint template with circular steps connected to a central node.
Add to Wishlist
Download
AI Customize
A comparison template with four numbered sections  arranged vertically in the center, with colored placeholder text boxes.
Add to Wishlist
Download
AI Customize
Scales comparison infographic showing a person holding balanced options with labels and percentages.
Add to Wishlist
Download
AI Customize
Colorful venn diagram slides comparing data and information showing differences between data and info in different layouts.
Add to Wishlist
Download
AI Customize
Cause and effect diagram with two large arrows in red and blue, each linked to icons in colored boxes.
Free
Add to Wishlist
Download
AI Customize
Comparison slide featuring business vs marketing with blue and yellow team icons and placeholder text areas.
Add to Wishlist
Download
AI Customize
Comparison chart PPT template with side by side horizontal bar charts showing percentages, each paired with an icon.
Free
Add to Wishlist
Download
AI Customize
Comparison slide for PowerPoint showing progress percentages for four steps with icons of a man and a woman.
Free
Add to Wishlist
Download
AI Customize
Cause and effect slide with purple circular sections, icons, and connecting arrows, divided into three steps.
Add to Wishlist
Download
AI Customize
Comparison chart design featuring three hexagonal shapes labeled Project Name 01, 02, and 03, with colorful outlines.
Add to Wishlist
Download
AI Customize
Comparison infographic with two sections divided by a vertical line, each with colored caption areas for analysis.
Free
Add to Wishlist
Download
AI Customize
Green themed cause and effect PPT slide diagram with a circular center and six connected placeholder text boxes.
Free
Add to Wishlist
Download
AI Customize
A slide comparing two results with hourglass icons, showing a percentage breakdown with a man presenting the comparison.
Add to Wishlist
Download
AI Customize
Slide with four gray text box with colored edges, pointing inward from both sides toward the numbered center.
Free
Add to Wishlist
Download
AI Customize
A business cause and effect diagram template, featuring hexagonal cause blocks with a central effect block.
Add to Wishlist
Download
AI Customize
Venn diagram with two overlapping circles in purple and teal, surrounded by six text and icons.
Add to Wishlist
Download
AI Customize
Two column comparison slide with AI advantages on the left and disadvantages on the right, each listing four key points.
Add to Wishlist
Download
AI Customize
Competitor analysis slide showing two employees, Alex Fern Ado and Albert Steven, with social media performance comparison.
Add to Wishlist
Download
AI Customize
Product comparison table slide with a green section highlighting advantages and a red section showing disadvantages.
Free
Add to Wishlist
Download
AI Customize
Three blue circular elements with numbers and text areas connected to a central document icon in a cause and effect layout.
Free
Add to Wishlist
Download
AI Customize
Illustrated figure holding balanced scales with green and white bowls, arrows on a black background with four caption areas.
Add to Wishlist
Download
AI Customize
Change PPT template with before and after sections, showcasing content areas with color coded arrows and icons.
Add to Wishlist
Download
AI Customize
Corporate PPT slide with headings and captions, displaying icons and checkmarks alongside silhouettes of businesspeople.
Free
Add to Wishlist
Download
AI Customize
Get Free PowerPoint Cause And Effect Download Template
Free
Add to Wishlist
Download
AI Customize
A professional comparison slide featuring horizontal bar graphs displaying various percentages alongside captions with icons.
Free
Add to Wishlist
Download
AI Customize
Comparison slide showing a 45 male and 58 female percentages distribution with arrows pointing towards each gender.