Climate Vs Temperature PowerPoint Google Slides Template

 Canva
Canva
Climate Vs Temperature PowerPoint, Google Slides, and Canva Template
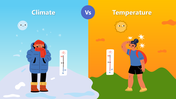
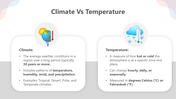
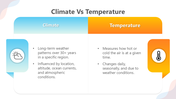
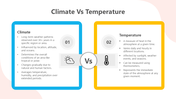
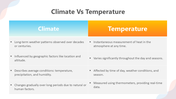
Climate Vs Temperature When discussing environmental factors, it’s crucial to distinguish between climate and temperature. These two are they describe different concepts in the study of Earth’s atmosphere. Climate refers to the average weather conditions over a long period in a specific region, typically spanning decades to centuries. On the other hand, temperature is a measure of the warmth or coldness of a location at any given time.
Purpose Of The Slides
This slide deck is designed to help students and professionals understand the fundamental differences between climate and temperature. It explores how climate is influenced by long-term weather patterns, while temperature focuses on short-term fluctuations in heat or cold. The visuals and informative text on the slides will guide users through the critical differences, providing clear examples of different climate zones and temperature variations.
Who Can Use It?
This slide deck is perfect for educators, students, and professionals in the fields of environmental science, geography, and meteorology. It’s an excellent resource for middle school to college-level students and anyone needing a clear, concise breakdown of these essential atmospheric concepts.
Special Key Features
Each slide includes vibrant visuals, concise text, and is highly customizable for your specific presentation needs.
Features of this template
- 100% customizable slides and easy to download.
- The slides contain 16:9 and 4:3 formats.
- Easy to change the colors quickly.
- Highly compatible with PowerPoint, Google Slides, and Canva templates.










You May Also Like These PowerPoint Templates





















Showing36 of69,218 templates