Sourcing Vs Procurement PowerPoint And Google Slides

 Canva
Canva
Sourcing Vs Procurement PowerPoint, Google Slides, And Canva Template
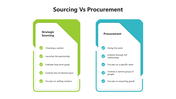
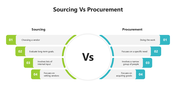
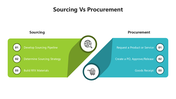
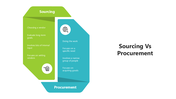
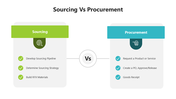
Sourcing Vs Procurement is a key comparison in supply chain and procurement strategies. This 13-slide presentation breaks down both concepts—highlighting how sourcing involves finding and evaluating suppliers, while procurement focuses on acquiring goods and services efficiently. Understand the differences and interdependencies with this sleek, insightful visual deck.
Purpose Of The Slides
This 13-slide multicolor presentation is designed to clearly illustrate the differences between sourcing and procurement. With side-by-side layouts, icons, and workflows, the slides help explain key functions such as vendor selection, strategy development, and order fulfillment—making complex processes easier to understand.
Who Can Use It?
Procurement professionals, supply chain managers, corporate trainers, and academic instructors can use this deck to compare processes, present policy differences, or drive strategic sourcing discussions. Ideal for use in workshops, webinars, or internal training sessions. Also great for procurement courses and certification programs.
Special Key Features
This presentation features editable slides, comparison tables, icon sets, and visual timelines. It highlights the sourcing-procurement distinction in a structured, easy-to-grasp layout.
Download this comparison PPT template now and deliver strategic insights that make an impact—one slide at a time.
Features of this template
- 100% customizable slides and easy to download.
- The slides contain 16:9 and 4:3 formats.
- Easy to change the colors quickly.
- Highly compatible with PowerPoint, Google Slides, and Canva templates.


You May Also Like These PowerPoint Templates

Add to Wishlist
Download
Edit

Add to Wishlist
Download
Edit

Add to Wishlist
Download
Edit


Add to Wishlist
Download
Edit

Add to Wishlist
Download
Edit

Add to Wishlist
Download
Edit

Add to Wishlist
Download
Edit

Add to Wishlist
Download
Edit

Add to Wishlist
Download
Edit

Add to Wishlist
Download
Edit

Add to Wishlist
Download
Edit

Add to Wishlist
Download
Edit

Add to Wishlist
Download
Edit

Add to Wishlist
Download
Edit

Add to Wishlist
Download
Edit

Add to Wishlist
Download
Edit

Add to Wishlist
Download
Edit
