PowerPoint Speedometer Template for Monitoring Progress

PowerPoint slide with a red speedometer graphic indicating 70 percent performance or progress.
P.ID : 17010
    132 views
    12 Downloads
    Get Custom Slides by Experts
    Instantly Access Templates in PowerPoint

    PowerPoint Speedometer Template


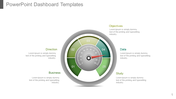
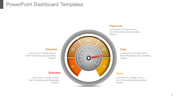
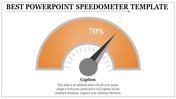
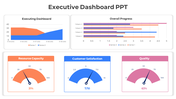
    Improve the position of your infographics by introducing our PowerPoint Speedometer Template. The slide comes with a sleek speedometer gauge. It is accompanied by a percentage value. This provides a visually impactful representation of progress and performance. Ideal for project managers, sales professionals and executives. 

    Suitable for tracking sales targets, project milestones or performance goals. Download to command attention and leave a lasting impression on clients, stakeholders and colleagues alike. 

    Features of the template

    • The slide contains 16:9 and 4:3 formats.
    • Compatible with Google slide themes and PowerPoint.
    • 100% customizable slides and easy to download.
    • It is easy to change the colors of the slide quickly.
    • Well-crafted template with an instant download facility.
    Advertisement

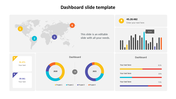
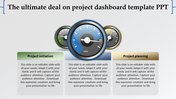
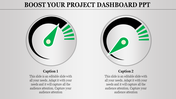
    You May Also Like These PowerPoint Templates

    Add to Wishlist
    Download
    AI Customize
    KPI PPT slide featuring circular progress indicators and a table of data values with captions on a white backdrop.
    Add to Wishlist
    Download
    AI Customize
    Sales KPI PPT slide featuring charts for Revenue, Revenue Comparison, New Customers, and Customer Acquisition Cost CAS.
    Free
    Add to Wishlist
    Download
    AI Customize
    Dashboard slide with a world map highlighting countries, a bar chart showing statistics, and two percentage indicators.
    Free
    Add to Wishlist
    Download
    AI Customize
    Five-level bar chart executive dashboard with colored blocks labeled with five levels, showing a gradual progression.
    Add to Wishlist
    Download
    AI Customize
    Our Predesigned KPI Presentation Template Slide Design
    Add to Wishlist
    Download
    AI Customize
    Modern dashboard PowerPoint template featuring circular progress charts, bar graphs, and key performance metrics.
    Free
    Add to Wishlist
    Download
    AI Customize
    Bar chart comparing increases and decreases for movies like Avatar and Aquaman, with title logos below.
    Add to Wishlist
    Download
    AI Customize
    Speedometer dashboard PowerPoint slides showing three colored gauges with 25, 50, and 75 percent progress with captions.
    Add to Wishlist
    Download
    AI Customize
    Executive Dashboard slide showing key performance metrics such as revenue vs. target, customer acquisition, and CAC vs. CLV.
    Free
    Add to Wishlist
    Download
    AI Customize
    Colorful project dashboard PPT slide showing a bar chart for four sections with a pie chart detailing percentages.
    Add to Wishlist
    Download
    AI Customize
    Slide with a revenue chart and metrics for daily, weekly, and yearly sales, along with three user graphs.
    Add to Wishlist
    Download
    AI Customize
    Central speedometer style gauge with red, yellow, blue, and green sections, surrounded by numbered text boxes.
    Add to Wishlist
    Download
    AI Customize
    KPI dashboard with a dual-line graph, balance performance gauge, and quarterly income metrics.
    Free
    Add to Wishlist
    Download
    AI Customize
    Project dashboard with a table containing rows for tasks, dates, and signature for author, client, and manager approval.
    Add to Wishlist
    Download
    AI Customize
    Business dashboard with progress indicators for promotion, channel management, and revenue metrics.
    Free
    Add to Wishlist
    Download
    AI Customize
    Colorful dashboard style meters PPT slide with captions and placeholder text.