Slidea Logo
Try it now — the new, easy way to turn your slides into an interactive experience.
Explore Now

Methods For Consumer Research PowerPoint And Google Slides

Pack of 18 slides
P.ID : 77303
Advertisement
1 views
1 Downloads
Get Custom Slides by Experts
Enhance Your Presentations with Add-ins
Google Slides Add-in
Access templates directly in Google Slides
Microsoft PowerPoint Add-in
Access templates directly in PowerPoint
GPT Add-on
AI-powered presentation assistance
  1. Methods for Consumer Research PowerPoint, Google Slides, and Canva Template

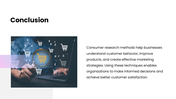
The Methods for Consumer Research PowerPoint presentation template is carefully crafted to help you explain how businesses understand customer behavior in a clear, simple, and visually engaging way. It is ideal for marketers, business professionals, educators, and students who want to present consumer insights, research techniques, and data-driven strategies with confidence.


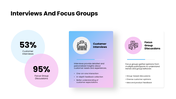
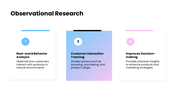
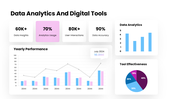
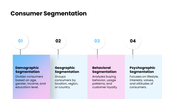
This template features a clean multi-color theme combined with soft modern layouts that create a professional and trustworthy presentation style. The slides are thoughtfully organized to cover key topics such as surveys and questionnaires, interviews and focus groups, observational research, data analytics tools, and consumer segmentation. Each section is designed to break down complex research methods into easy-to-understand visuals, making it perfect even for beginners.


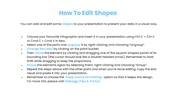
All shapes, icons, charts, and text elements are fully editable, allowing you to customize the content based on your business needs, academic topics, or marketing strategies. You can quickly update data, adjust colors, and modify layouts without needing advanced design skills.

Make your research presentations more engaging and effective. Download the Methods for Consumer Research PowerPoint template today and turn your data into meaningful insights.


Features of this template

  • 100% customizable slides and easy to download.
  • The slides contain 16:9 and 4:3 formats.
  • Easy to change the colors quickly.
  • Highly compatible with PowerPoint, Google Slides, and Canva templates.

You May Also Like These PowerPoint Templates

Add to Wishlist
Download
AI Customize
 Slide deck on market research templates, showing pie charts, flow diagrams, and circular graph in various colors.
Add to Wishlist
Download
AI Customize
Research presentation slide with a magnifying glass focusing on the word and a text block with two icons.
Add to Wishlist
Download
AI Customize
Slide pack featuring PICO question framework with multiple layouts, using yellow, red, blue, and gray color schemes.
Add to Wishlist
Download
AI Customize
Research slide with four blue and gray semi-circular percentage completion rings and product images, each with text areas.
Add to Wishlist
Download
AI Customize
2021 calendar template showing monthly grids for all 12 months with labeled weekdays and color-coded sections for each month.
Add to Wishlist
Download
AI Customize
Market research dashboard with a segmented horizontal bar chart analyzing brand perception and a donut chart.
Add to Wishlist
Download
AI Customize
Market analysis PPT slide with five circular progress bars, each displaying a percentage and accompanied by placeholder text.
Add to Wishlist
Download
AI Customize
Add to Wishlist
Download
AI Customize
Market research infographic PPT slide showing a 70-30 percent comparison with user icons and financial symbol with a caption.
Add to Wishlist
Download
AI Customize
Market research slides include topics like primary research, secondary research, and qualitative and quantitative approaches.
Add to Wishlist
Download
AI Customize
Colorful chart with six bars in blue, pink, green, red, yellow, and purple, each topped with a rocket icon and captions.
Add to Wishlist
Download
AI Customize
Add to Wishlist
Download
AI Customize
Market research slide with 60% in blue and 40% in red, each paired with gender icons and proportional figure graphics.
Add to Wishlist
Download
AI Customize
Four colored caption boxes linked to green, yellow, blue, and red circular icons, forming part of a segmented circular chart.
Add to Wishlist
Download
AI Customize
An upward-branching diagram from a house icon with four sections representing different steps, each marked by a icon.
Free
Add to Wishlist
Download
AI Customize
Slide featuring research methodology with four methods accompanied by illustrations of people analyzing data with text area.
Add to Wishlist
Download
AI Customize
Slide showing six colorful boxes in brown, blue, red, green, purple, yellow, and gray, with icons for research techniques.