Infographics PowerPoint Presentation Template and Google Slides

Infographics PowerPoint template with overlapping colorful circles and six caption areas.
P.ID : 13486
    495 views
    31 Downloads
    Get Custom Slides by Experts
    Instantly Access Templates in PowerPoint

    Dazzle with Data: Infographics For PowerPoint Template


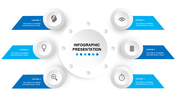
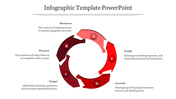
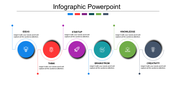
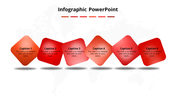
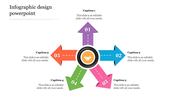
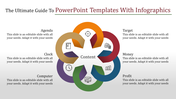
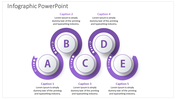
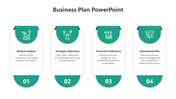
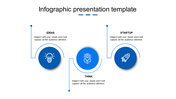
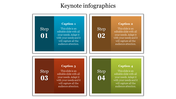
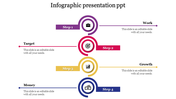
    Lists of infographics offer a visually appealing way to present information, with each infographic representing a key point or concept. Transform your presentations with our Infographics for PowerPoint Presentation Template & Google Slides Themes. Featuring colorful bubbles and six captions, each with a text area, this template is perfect for professionals looking to dazzle their audience with engaging visuals. Ideal for marketers, educators, and analysts, it allows you to showcase data, trends, and concepts in a captivating manner. Whether illustrating market trends, summarizing research findings, or presenting key statistics, this template empowers you to convey information with clarity and impact.

    Features of the template


    • 100% customizable slides are easy to download.
    • Slides are available in different colors.
    • The slide has 4:3 and 16:9 formats.
    • It is easy to change the slide colors quickly.
    • It has a cute design to impress an audience.
    • Create feature-rich, animated presentations.
    Advertisement

    You May Also Like These PowerPoint Templates

    Free
    Add to Wishlist
    Download
    AI Customize
    Infographics Of Oceanian PowerPoint And Google Slides
    Free
    Add to Wishlist
    Download
    AI Customize
    Infographic PPT slide displaying four steps with green arrows, each linked to business, process, target, and growth concepts.
    Add to Wishlist
    Download
    AI Customize
    Infographic slide with four steps in a horizontal layout, featuring colorful numbered icons and descriptions.
    Free
    Add to Wishlist
    Download
    AI Customize
    Infographic with a central icon and five petal like sections in red, blue, yellow, orange, and teal, for business concepts.
    Add to Wishlist
    Download
    AI Customize
    Four orange and yellow 3D blocks labeled A, B, C, and D, arranged diagonally with captions at each corner.
    Add to Wishlist
    Download
    AI Customize
    Infographic slide with four numbered sections featuring icons and text descriptions, arranged vertically.
    Free
    Add to Wishlist
    Download
    AI Customize
    Infographic PowerPoint slide showing five red steps, with descriptions for business, process, target, growth, and profit.
    Add to Wishlist
    Download
    AI Customize
    Business PowerPoint slide with colorful arrows representing different years from 2016 to 2020, featuring icons with captions.
    Add to Wishlist
    Download
    AI Customize
    Colorful infographic slide with a vertical flow of icons and captions with placeholder text.
    Add to Wishlist
    Download
    AI Customize
    Infographic with a yellow outlined central octagon and three octagons linked by black lines, labeled A to C.
    Free
    Add to Wishlist
    Download
    AI Customize
    Circular infographic with eight dark and light red triangular segments, each numbered and captioned.
    Add to Wishlist
    Download
    AI Customize
    Modern circular infographic with six icons and matching yellow caption boxes connected to a central circle.
    Add to Wishlist
    Download
    AI Customize
    Infographic presentation template featuring a green triangular layout with five sections, each marked by an icon and caption.
    Add to Wishlist
    Download
    AI Customize
    Circular infographic with nine red triangular sections numbered 1 to 9, centered around a handshake icon.
    Add to Wishlist
    Download
    AI Customize
    Arrow Infographics PPT And Google Slides With 6 Nodes
    Add to Wishlist
    Download
    AI Customize
    Infographic design with a central title and five numbered icons in green, purple, yellow, red, and blue segments.
    Add to Wishlist
    Download
    AI Customize
    Three circular infographic elements with icons and captions, each linked by vertical lines to numbered circles below.