Free - Awesome Circle Infographic PowerPoint and Google Slides
Free

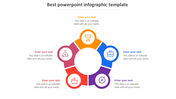
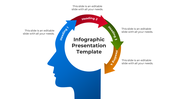
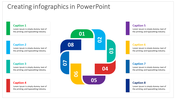
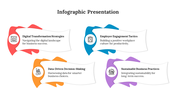
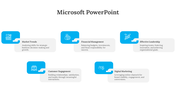
Creative Circular Infographics Presentation Slides
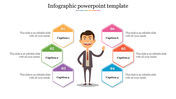
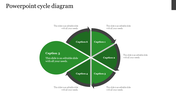
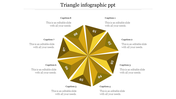
Circular infographics are a graphical representation of data or information using a circular shape divided into segments or spokes. Their uniqueness lies in their ability to present complex information in a visually appealing and easily digestible format. You have the best option to employ our templates on a circle diagrams infographic PPT theme to showcase statistics, comparisons, timelines, processes, and more. With the circular spokes and nodes, you can create a circular flow in presentation that leads the viewer's eye from one spoke to the next, making it an effective way to communicate a message or tell a story. Also, represent different categories or stages of a process, while the segments can display relevant data or information.
Features of the template
- 100% customizable slides are easy to download.
- Slides are available in different nodes and colors.
- The slide contains 16:9 and 4:3 formats.
- Easy to change the slide colors quickly.
- Well-crafted template with an instant download facility.
- Access on both MS PowerPoint and Google Slides.


You May Also Like These PowerPoint Templates


Add to Wishlist
Download
Edit


Add to Wishlist
Download
Edit

Add to Wishlist
Download
Edit

Add to Wishlist
Download
Edit

Add to Wishlist
Download
Edit

Add to Wishlist
Download
Edit

Add to Wishlist
Download
Edit


Add to Wishlist
Download
Edit

Add to Wishlist
Download
Edit

Add to Wishlist
Download
Edit

Add to Wishlist
Download
Edit

Add to Wishlist
Download
Edit

