Indonesia Map PPT Presentation for Google Slides Template

Colorful map of Indonesia with four percentage markers in orange, purple, teal, and red, with captions on each side.
P.ID : 52714
    960 views
    212 Downloads
    Get Custom Slides by Experts
    Instantly Access Templates in PowerPoint

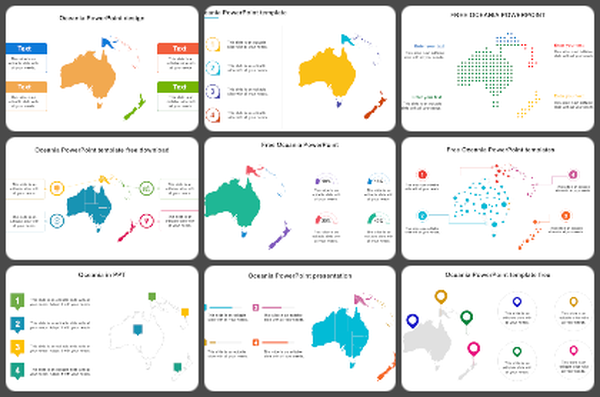
    Indonesia Map Presentation Slide

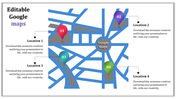
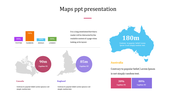
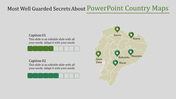
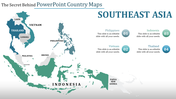
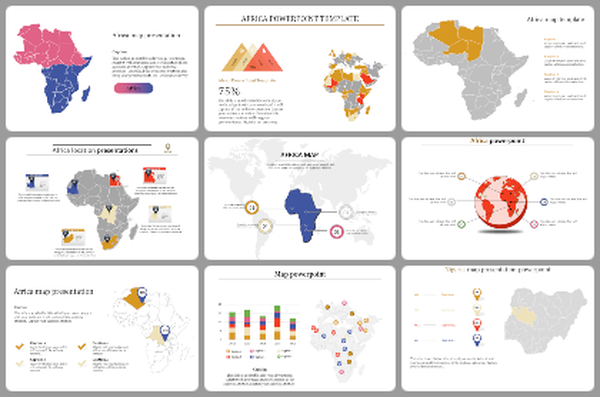
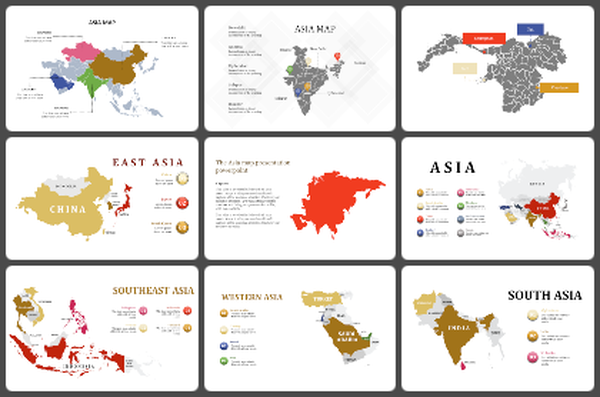
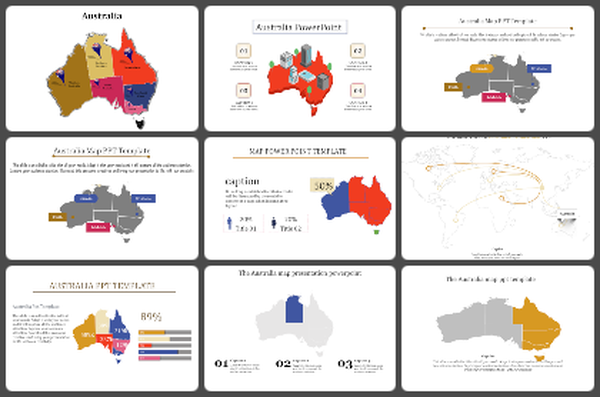
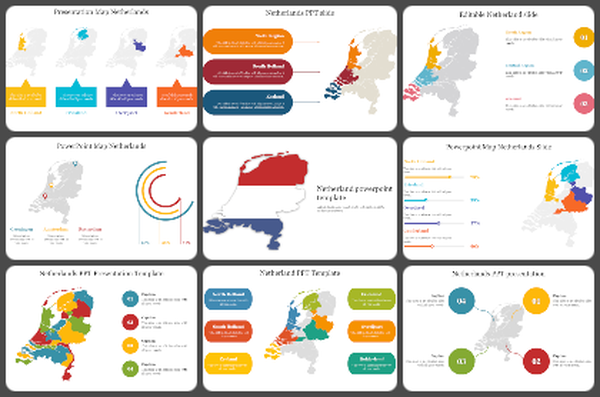
    Indonesia is a beautiful archipelago that boasts diverse cultures, breathtaking natural wonders, and a rich history. With its 17,000 islands, the country offers a unique experience to explore. Our colorful illustration features four nodes, each of which can be easily highlighted, colored, and detached as needed. Furthermore, the nodes can be paired with color-coded pins to identify specific locations or areas of interest within the illustration. This user-friendly tool allows for easy customization and organization, making it an effective aid for visual communication and presentations.


    Features of the template

    • 100% customizable slides and easy to download.
    • Slides are available in different nodes & colors.
    • The slide contains 16:9 and 4:3 formats.
    • Easy to change the colors of the slide quickly.
    • Well-crafted template with an instant download facility.
    • Highly compatible with PowerPoint and Google Slides.
    • This is a flexible map template for easy understanding.
    • It is a pre-built design to save time.
    Advertisement

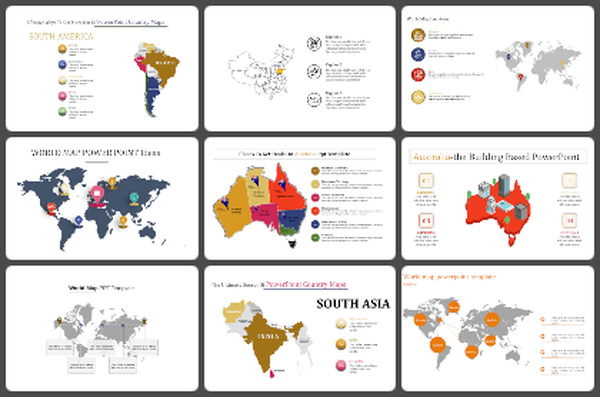
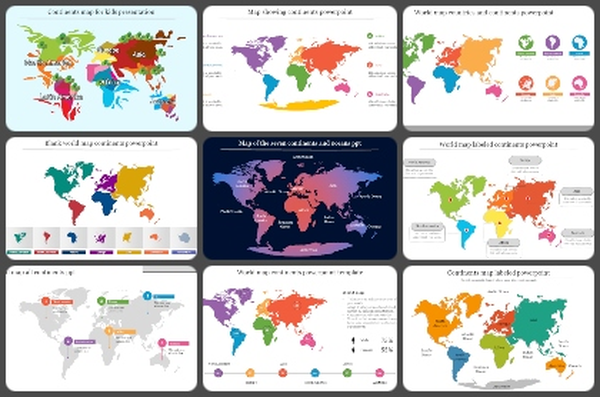
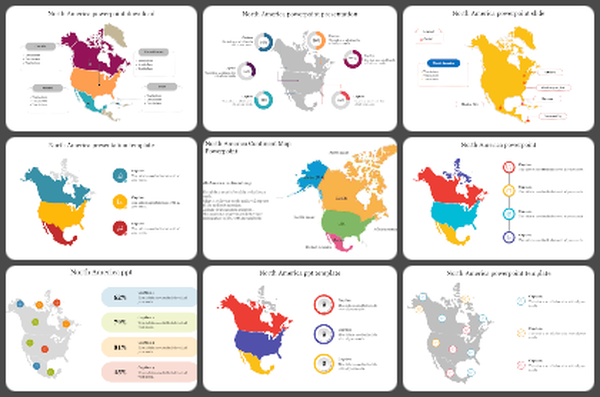
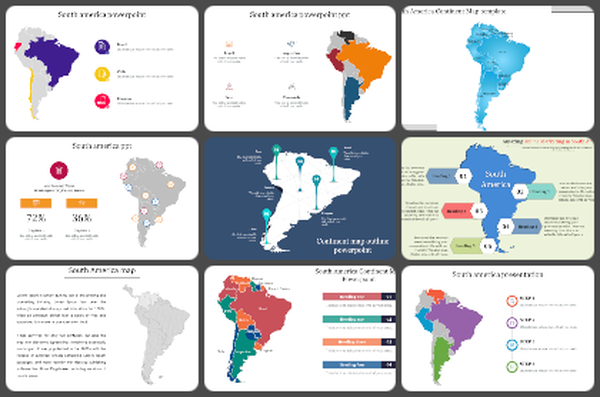
    You May Also Like These PowerPoint Templates

    Free
    Add to Wishlist
    Download
    AI Customize
    Map of Switzerland displaying regions in different colors, labeled Graubünden, Valais, Vaud, Luzern, Jura, and Zurich.
    Add to Wishlist
    Download
    AI Customize
    Europe map slide with labeled pins marking cities like Paris, Berlin, DSLD, and Bucharest, accompanied by descriptive text.
    Add to Wishlist
    Download
    AI Customize
    India map slide highlighting the states in different colors.
    Add to Wishlist
    Download
    AI Customize
    Minnesota state map highlighting key counties with four labels each with brief descriptions.
    Add to Wishlist
    Download
    AI Customize
    Gray Tokyo map with three colorful fan icons pointing to text areas on a white background.
    Add to Wishlist
    Download
    AI Customize
    Comoros map template featuring labeled regions with icons in colored boxes on a gray background.
    Add to Wishlist
    Download
    AI Customize
    Blank Map of Continents and Oceans PowerPoint
    Add to Wishlist
    Download
    AI Customize
    Indonesia map presentation slide with colorful percentage icons and data with placeholder text.
    Add to Wishlist
    Download
    AI Customize
    Gray outline map of the Netherlands centered with six colored caption boxes in yellow, teal, purple, orange, pink, and red.
    Add to Wishlist
    Download
    AI Customize
    Gray Singapore map with five highlighted regions, and location details on the right with flag in the left corner.
    Add to Wishlist
    Download
    AI Customize
    Effective Paris Template PPT Free Slide With Two Nodes
    Free
    Add to Wishlist
    Download
    AI Customize
    A dotted circle with a Cuba map in the center, surrounded by blue, purple, orange, and red text boxes connected by lines.
    Free
    Add to Wishlist
    Download
    AI Customize
    Europe map slide with markers showing data points for different regions, accompanied by captions for each area.
    Add to Wishlist
    Download
    AI Customize
    Europe continent map with various slides highlighting countries like France, Spain, Italy, and Sweden with icons and text.
    Free
    Add to Wishlist
    Download
    AI Customize
    Gray map of Japan with a red pin marking Tokyo, with text information on the right side.
    Add to Wishlist
    Download
    AI Customize
    Map of the U.S. with Montana, Iowa, Ohio, and Texas highlighted, each in a different color with a caption areas.
    Add to Wishlist
    Download
    AI Customize
    Europe PowerPoint template showcasing a color coded map of Europe with location markers and a pie chart for additional data.