Black FridaySave Up to 50% on Lifetime plan

Elegant Harvey Ball Map Slide Presentation PPT Themes

Free

Nodes

World map infographic with four harvey ball charts in blue, pink, teal, and orange, showing varying percentage values.

Colors

    P.ID : 47950
    68 Views
    9 Downloads
    Kavitha Designer
    Get Custom Slides by Experts
    Enhance Your Presentations with Add-ins

    Tags

    • Harvey Ball Diagrams
    • Free Slide
    Advertisement

    Colorful World Map Slide With Colorful Harvey Balls 

    Get this elegant Harvey ball slide to make enlightening presentations to visually communicate your qualitative information. It will help you indicate the degree to which a certain item meets a particular criterion. This slide includes a well-made world map in which North and South America, Africa, and Australia are marked with colorful Harvey balls representing various percentage values. Each node has a text block for your notes. You can compare the information related to these four continents using this slide. The stunning layout with incredible designs will help you make brilliant presentations instantly. Furthermore, it's entirely editable according to your presentation requirements. Download now!

    Features of the template

    • 100% customizable slides and easy to download.
    • Slides are available in different nodes & colors.
    • The slide contains 16:9 and 4:3 formats.
    • Easy to change the colors of the slide quickly.
    • Well-crafted template with an instant download facility.
    • Creative ready-made slide for instant presentations. 

    More Collections for Elegant Harvey Ball Map Slide Presentation PPT

    Recommended based on this template.

    Similar Templates to Elegant Harvey Ball Map Slide Presentation PPT
    Free
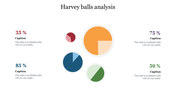
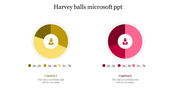
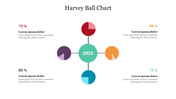
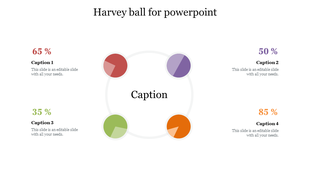
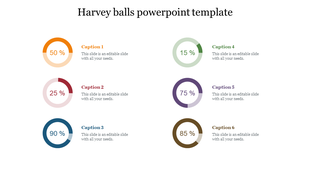
    Harvey ball layout featuring red, purple, green, and orange circles with percentage values and text captions on each side.
    Free
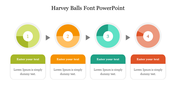
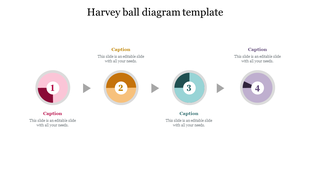
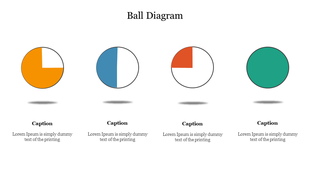
    Four circular Harvey ball graphics labeled 1 to 4, each partially filled and followed by colored caption text below.
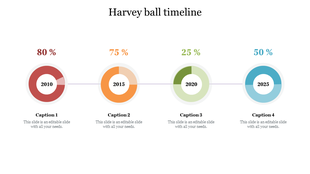
    Harvey ball timeline slide showing percentages for 2010, 2015, 2020, and 2025 with corresponding captions.
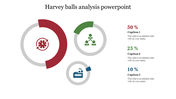
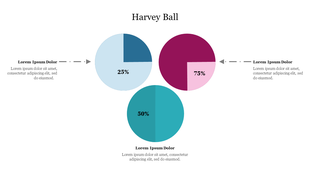
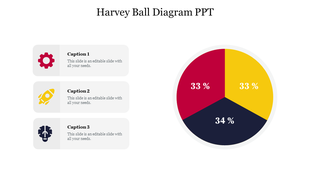
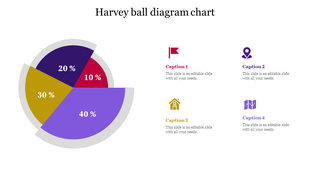
    Harvey ball pie chart with three equal sections in red, yellow, and dark, linked to icons with text box.
    Free
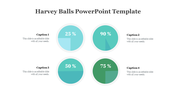
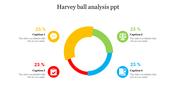
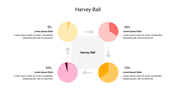
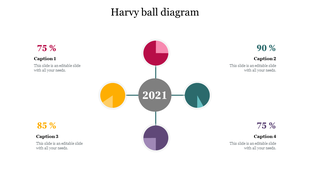
    Harvey ball graphic with four percentage segments around a central year label, color-coded and paired with caption areas.
    Free
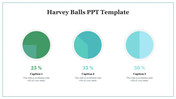
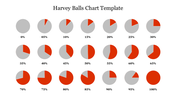
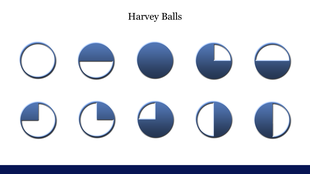
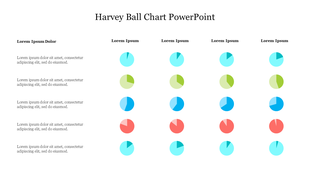
    Harvey Balls infographic showing circles in varying degrees of shading to represent percentage completion.
    Free
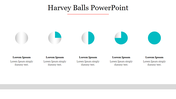
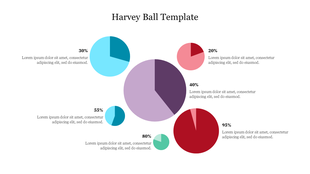
    Infographic slide with colorful Harvey ball chart showing five different completion levels ranging from 20 to 95 percent.
    Free
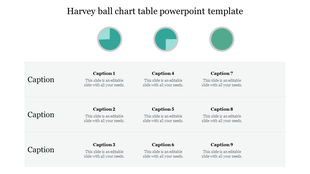
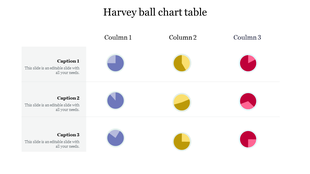
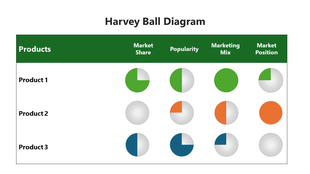
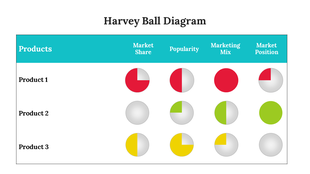
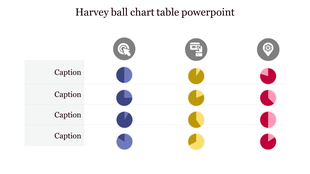
    PowerPoint slide featuring a table with Harvey ball charts, representing data with colored segments and icons with captions.

    Showing20 of69,218 templates