Amazing What Is A Harvey Ball PowerPoint Template Slide

Amazing What Is A Harvey Ball PowerPoint Template Slide
P.ID : 66037
    19 views
    1 Downloads
    Get Custom Slides by Experts
    Instantly Access Templates in PowerPoint

    Unique What Is A Harvey Ball PowerPoint Template Slide

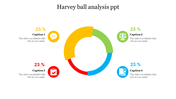
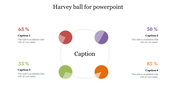
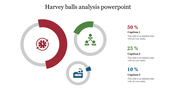
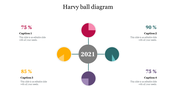
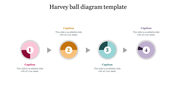
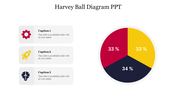
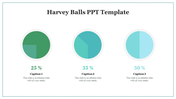
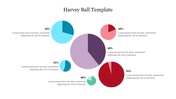
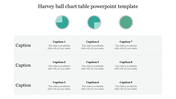
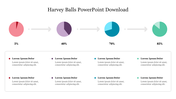
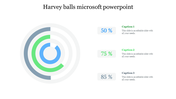
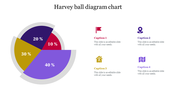
    What Is A Harvey Ball? Harvey Balls are a state indicator commonly used for comparison in presentations and reports. These are PPT for visual communication and representation of qualitative information. You might find Harvey Balls in several comparison types, such as comparing a product by price, weight, quality, taste, safety, etc.

    About the template

    In the middle of What Is A Harvey Ball? PPT stands for a white Circle where you can write items you would like to compare and produce the results. Harvey balls can be suitable for depicting qualitative information and easy to grasp for an audience. Similarly, using images instead of digits can be helpful for an audience who might find large chunks of information confusing. Try our infographic presentation for comparison.  

    Features of this Template:

    1.100% customizable slides and easy to download.

    2.Slides available in different nodes & colors.

    3.The slide contained 16:9 and 4:3 format.

    4.Easy to change the slide colors quickly.

    5.Well-crafted template with instant download facility.

    6.One of the best templates from SlideEgg.

    7.Crisp and clear font styles.

    Advertisement

    You May Also Like These PowerPoint Templates

    Add to Wishlist
    Download
    AI Customize
    Harvey ball slide with circular charts in teal, green,  blue, red, and light blue, arranged in a grid format.
    Add to Wishlist
    Download
    AI Customize
    Slide showing colorful Harvey balls at different completion levels accompanied by captions.
    Add to Wishlist
    Download
    AI Customize
    Infographic slide with colorful Harvey ball chart showing six different completion levels ranging from 20 to 95 percent.
    Free
    Add to Wishlist
    Download
    AI Customize
    PowerPoint slide featuring a table with Harvey ball charts, representing data with colored segments and icons with captions.
    Free
    Add to Wishlist
    Download
    AI Customize
    Circular Harvey Balls showing percentages from 25% to 75% with colored segments and captions areas.
    Add to Wishlist
    Download
    AI Customize
    Free Harvey Balls PowerPoint Template and Google Slides
    Add to Wishlist
    Download
    AI Customize
    Series of 21 Harvey balls, with percentages from 0 to 100, showing progressive red fill in each circle.
    Add to Wishlist
    Download
    AI Customize
    A comparison table of three products with coloured Harvey balls showing varied degrees of completion across four categories.
    Add to Wishlist
    Download
    AI Customize
    Slide deck with harvey balls charts in various colors, featuring circular segments to indicate percentage progress.
    Add to Wishlist
    Download
    AI Customize
    Five Harvey Balls with varying fill levels, from empty to fully filled, with placeholder captions below each.
    Add to Wishlist
    Download
    AI Customize
    Harvey balls font slide featuring circular graphics with a placeholder text box.
    Free
    Add to Wishlist
    Download
    AI Customize
    Harvey Balls infographic showing circles in varying degrees of shading to represent percentage completion.
    Add to Wishlist
    Download
    AI Customize
    Harvey balls chart showing progress percentages in orange, blue, red, and  green, with space for caption area below.
    Add to Wishlist
    Download
    AI Customize
    Best Download Harvey Balls PowerPoint For Presentation
    Add to Wishlist
    Download
    AI Customize
    A Harvey ball chart table with three columns displaying partially filled colored circles for comparison of three categories.
    Add to Wishlist
    Download
    AI Customize
    Harvey Balls PowerPoint template with three colorful segments labeled with captions and icons.
    Free
    Add to Wishlist
    Download
    AI Customize
    Four circular charts in blue, orange, green, and red with percentage values and icons above each segment.