Effective Harvey Balls PowerPoint Table Presentation

Infographic slide with colorful Harvey ball chart showing six different completion levels ranging from 20 to 95 percent.
P.ID : 66040
    512 views
    98 Downloads
    Get Custom Slides by Experts
    Instantly Access Templates in PowerPoint

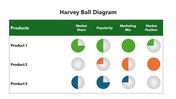
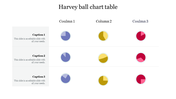
    Representational Table Inserted Template

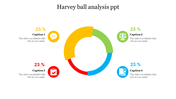
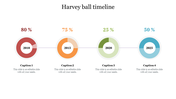
    Get hold of this representational table-filled template, which is available for you at an affordable cost with exciting nodes and captions inside them. You can use this template to enter your detailed explanation about your discussed topic. Here we can find five nodes with four columns and five rows, which aid you in entering your details that are highly attractive and drastically pull the audience's attention. 

    About the template

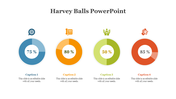
    You can even alter the template using the amicable options provided by us effortlessly. Also, you can find the Harvey balls in pie chart shape given inside the nodes adds up more value to your presentation. Henceforth, quickly download this template.

    Features of the Template

    • 100% customizable slides and easy to download
    • Slides are available in different nodes & colors.
    • The slides contained 16:9 and 4:3 formats.
    • Easy to change the slide colors quickly.
    • Well-crafted Template with an instant download facility.
    • Crisp and elegant font style. 
    • The best Template with attractive nodes.
    Advertisement

    You May Also Like These PowerPoint Templates

    Add to Wishlist
    Download
    AI Customize
    Harvey Ball chart slide showing four colored segments around a central circle labeled 2022, each with percentage values.
    Add to Wishlist
    Download
    AI Customize
    Harvey Google Slides and PowerPoint Presentation Template
    Add to Wishlist
    Download
    AI Customize
    Harvey Ball For PowerPoint Presentation Slide
    Add to Wishlist
    Download
    AI Customize
    Harvey Ball Diagram PowerPoint Templates
    Add to Wishlist
    Download
    AI Customize
    Harvey Balls Diagram Template Presentation Slide
    Add to Wishlist
    Download
    AI Customize
    PowerPoint slide with two Harvey balls showing categories based on percentage ranges and icons with captions.
    Add to Wishlist
    Download
    AI Customize
    World map infographic with four harvey ball charts in blue, pink, teal, and orange, showing varying percentage values.
    Add to Wishlist
    Download
    AI Customize
    Harvey balls analysis PowerPoint slide showing four sections with different percentages and captions.
    Add to Wishlist
    Download
    AI Customize
    Harvey ball pie chart with three equal sections in red, yellow, and dark, linked to icons with text box.
    Add to Wishlist
    Download
    AI Customize
    Infographic slide with colorful Harvey ball chart showing five different completion levels ranging from 20 to 95 percent.
    Add to Wishlist
    Download
    AI Customize
    Harvey balls template with three circular charts in green, teal, and blue shades, labeled with percentages and captions.
    Add to Wishlist
    Download
    AI Customize
    Effective Harvey Ball Chart Table PowerPoint Template
    Add to Wishlist
    Download
    AI Customize
    Harvey Balls PowerPoint slide with four percentage indicators progressing from left to right with placeholder text.
    Add to Wishlist
    Download
    AI Customize
    PowerPoint slide with Harvey balls representing percentages in colored rings with captions on a white backdrop.
    Add to Wishlist
    Download
    AI Customize
    Harvey ball slide with circular charts in teal, green,  blue, red, and light blue, arranged in a grid format.
    Add to Wishlist
    Download
    AI Customize
    Slide showing colorful Harvey balls at different completion levels accompanied by captions.
    Add to Wishlist
    Download
    AI Customize
    Infographic slide with colorful Harvey ball chart showing six different completion levels ranging from 20 to 95 percent.
    Free
    Add to Wishlist
    Download
    AI Customize
    PowerPoint slide featuring a table with Harvey ball charts, representing data with colored segments and icons with captions.