Innovative Finance PPT Template and Google Slides Themes

A finance PowerPoint template showing a bar graph for the years 2010 to 2016 with placeholder text and captions.
P.ID : 34972
    158 views
    4 Downloads
    Get Custom Slides by Experts
    Instantly Access Templates in PowerPoint

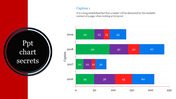
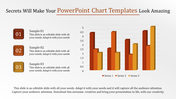
    Empower Your Financial Presentations with our Finance Template


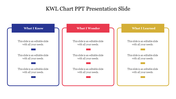
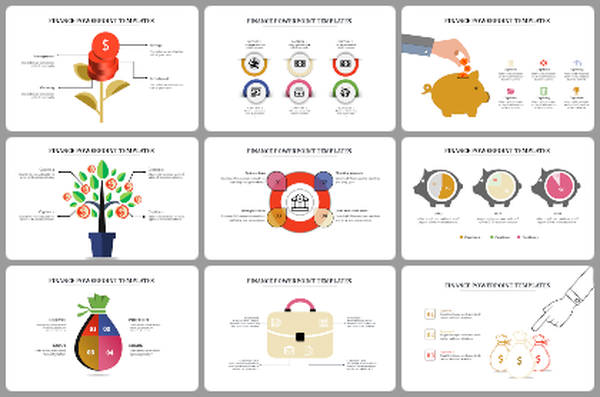
    Looking to enhance your financial presentations? Our Finance PPT Template and Google Slides Themes offer a comprehensive solution. Featuring a dynamic combination of charts, graphs, and four customizable captions, each adorned with a unique color theme. This template is for finance professionals, analysts, educators, and students. Whether you're delivering quarterly reports, investment analyses, budget presentations, or market insights, our template provides the perfect platform to convey your financial data with clarity and impact. With its user-friendly design and versatile elements, you can effortlessly craft compelling presentations that resonate with your audience. Elevate your financial storytelling and make your presentations stand out from the crowd. 

    Features of the template


    • 100% customizable slides are easy to download.
    • Slides are available in different colors.
    • The slide has 4:3 and 16:9 formats.
    • It is easy to change the slide colors quickly.
    • It has a cute design to impress an audience.
    • Create feature-rich, animated presentations.
    Advertisement

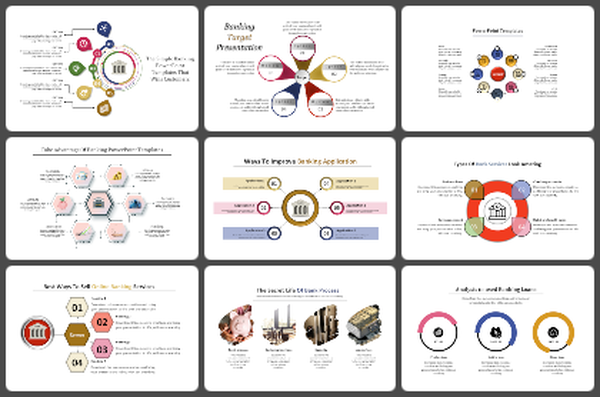
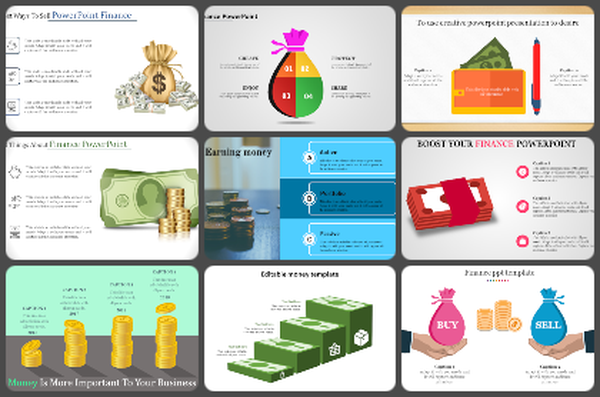
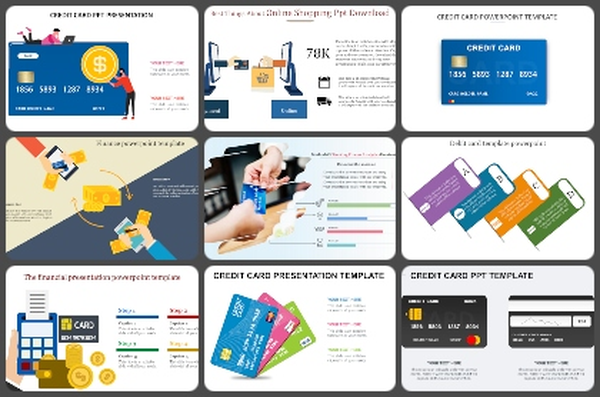
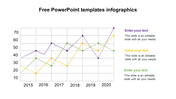
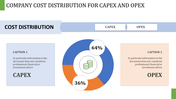
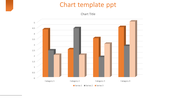
    You May Also Like These PowerPoint Templates

    Add to Wishlist
    Download
    AI Customize
    Dual chart template slide with scatter and bubble charts, the scatter chart on the left and the bubble chart on the right.
    Free
    Add to Wishlist
    Download
    AI Customize
    Slide with green and white sections, featuring pie and bar charts, and an engine image in the bottom right corner.
    Free
    Add to Wishlist
    Download
    AI Customize
    Infographic with a circular segmented chart in blue shades, centered around an AI head graphic placed in white background.
    Add to Wishlist
    Download
    AI Customize
    PowerPoint pie chart template with three segments and associated icons.
    Add to Wishlist
    Download
    AI Customize
    Three vertical rectangular sections with headers in green, blue, and orange, each with captions inside.
    Add to Wishlist
    Download
    AI Customize
    Colorful pie chart PowerPoint slide with five labeled sections and captions on a white backdrop.
    Free
    Add to Wishlist
    Download
    AI Customize
    Pie chart slide with a blue and dark blue donut chart showing 75% sales, two numbered text boxes on the right.
    Free
    Add to Wishlist
    Download
    AI Customize
    Green and black area chart with a star shaped yellow badge and four circular icons with text below.
    Add to Wishlist
    Download
    AI Customize
    Bar chart with green hues, showing data for six categories, with side status boxes and light text.
    Free
    Add to Wishlist
    Download
    AI Customize
    Three column layout with blue megaphone, orange lightbulb, and red envelope icons on a beige background.
    Add to Wishlist
    Download
    AI Customize
    3D triangular bar chart in yellow, orange, and blue shades showing monthly data for four categories, on a dark background.
    Free
    Add to Wishlist
    Download
    AI Customize
    A simple chart slide with overlaid blue, green, orange, and yellow circles of varying sizes with a graph and captions.
    Add to Wishlist
    Download
    AI Customize
    Gantt chart PowerPoint template showing a timeline for multiple targets across January, February, and March, with milestones.
    Add to Wishlist
    Download
    AI Customize
    Bar chart slide showcasing yearly data from 2016 to 2021, with three distinct bar categories and values in shades of purple.
    Add to Wishlist
    Download
    AI Customize
    3D cone chart with orange, pink, and blue segments, placed on a gray platform with a white background.
    Add to Wishlist
    Download
    AI Customize
    Bar chart slide showing the performance of four products with categories like sales growth, market share, and profit margin.
    Add to Wishlist
    Download
    AI Customize
    A creative PPT slide design featuring four stages from initiation to execution, each with icons and colorful segments.
    Add to Wishlist
    Download
    AI Customize
    Slide displaying two pie charts with quarter wise performance data, along with performance percentages at the bottom.
    Add to Wishlist
    Download
    AI Customize
    PowerPoint slide showcasing a chart with project status trends and a progress bar for each year.