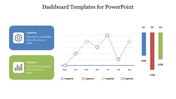
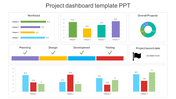
Amazing Executive Dashboard PPT Slide Template Design

An executive dashboard gauge slide with the needle positioned at 100, showing different measurement levels on the scale.
P.ID : 3888
    356 views
    1 Downloads
    Get Custom Slides by Experts
    Instantly Access Templates in PowerPoint
    How to Use Executive Dashboard PPTs to Communicate Your Information
     When you visit my site, you will learn about the idea behind using Executive Dashboard PPTs to communicate your information to the company. This is great for writing and personal use but can also be used to build a business in many different ways. It takes very little to create a quality dashboard PPT that will provide the information you need for your target audience. One of the key reasons why this is the key to success is because you do not have to worry about your information falling through the cracks. Several excellent tools are out there that will allow you to make an executive dashboard PPT without having to code anything at all. You will have to access the dashboard PPT directly, and it will be able to take care of itself. With the right information, you can set up the executive dashboard PPT to allow your audience to see exactly what your data is that they are dealing with. 
    The executive dashboard PPT that you create will become your key to success in your business. You can organize all of your data in a simple dashboard, which is great for when you are trying to stay organized. This is also a great tool to give to employees, allowing them to gain valuable knowledge on how to handle themselves. Creating a dashboard is easy to do, and the ability to customize it can help you create the right information for your overall business. You can easily see the information that you want to share with your audience, and you can easily filter the data. As well, you can make it as straightforward or as complicated as you want it to be. These new tools are great for anyone who wants to create a dashboard for their business. From blogs to landing pages, to newsletters, this is a tool that is utilized by many businesses. With the right information, you can easily get more people interested in your business and your product. Remember, the idea is to communicate with your audience, and you want to be sure that you are providing the information they need. When you have just the right tools, you can easily communicate your information to your audience and show them exactly what they need to know. This will help you be successful and increase your profit. 
    Advertisement

    You May Also Like These PowerPoint Templates

    Add to Wishlist
    Download
    AI Customize
    Butterfly chart with mirrored orange bars on either side, aligned symmetrically, and reducing in size towards the center.
    Add to Wishlist
    Download
    AI Customize
    Comprehensive KPI dashboard slide with performance indicators visualized through charts and graphs for business tracking.
    Free
    Add to Wishlist
    Download
    AI Customize
    KPI dashboard slide showcasing various business metrics through colorful bar charts, pie charts, and a gauge meter.
    Add to Wishlist
    Download
    AI Customize
    KPI format slide displaying financial performance metrics with detailed charts and figures.
    Add to Wishlist
    Download
    AI Customize
    Smart chart template slide showing bar and line charts labeled net profit alongside numbered caption area.
    Add to Wishlist
    Download
    AI Customize
    A bubble chart slide with four quadrants featuring colorful icons for key business strategies with a placeholder text area.
    Free
    Add to Wishlist
    Download
    AI Customize
     Sales Dashboard PPT Template & Google Slide Themes
    Add to Wishlist
    Download
    AI Customize
    Three speedometer charts slide with captions indicating different data points, highlighted in green, yellow, and orange.
    Add to Wishlist
    Download
    AI Customize
    SmartArt pie chart showing 65% in red and 35% in green as a and b, with placeholder captions and a text box.
    Free
    Add to Wishlist
    Download
    AI Customize
    Free Dashboard PowerPoint Template Design template
    Add to Wishlist
    Download
    AI Customize
    Radar PowerPoint Presentation Templates and Google Slides
    Add to Wishlist
    Download
    AI Customize
    Pentagon-shaped spider chart displaying two datasets in red and blue with two numbered caption areas.
    Add to Wishlist
    Download
    AI Customize
    Slide featuring a blue umbrella graphic with three labeled sections and two text boxes on the right.
    Free
    Add to Wishlist
    Download
    AI Customize
    Four vertical bar charts in orange, blue, red, and green on a white background, each with captions below.
    Add to Wishlist
    Download
    AI Customize
    Three semi circle gauges in pastel colors, with percentage labels above, and related text and icons beneath.
    Add to Wishlist
    Download
    AI Customize
    Three speedometers showing progress percentages: 25%, 50%, and 75%, with gradient colors in yellow, orange, and red.
    Free
    Add to Wishlist
    Download
    AI Customize
    Slide with three gauge meters in orange, yellow, and gray, each paired with a table for KPI metrics.
    Free
    Add to Wishlist
    Download
    AI Customize
    KPI presentation template displaying colorful charts for revenue, units sold, and product category analysis.