brazil powerpoint template design

Brazil map infographic highlighting four regions using pie charts in purple, blue, green, and yellow.
P.ID : 48298
    48 views
    1 Downloads
    Get Custom Slides by Experts
    Instantly Access Templates in PowerPoint

    Best Brazil PowerPoint Slides

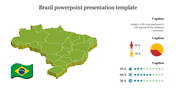
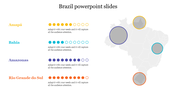
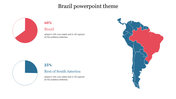
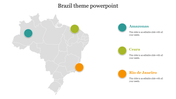
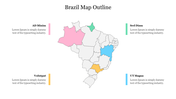
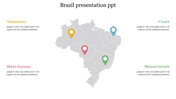
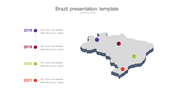
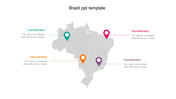
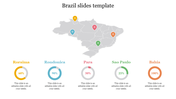
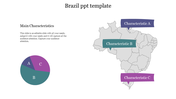
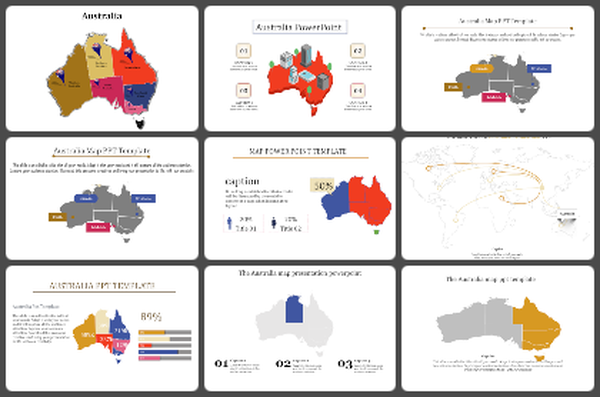
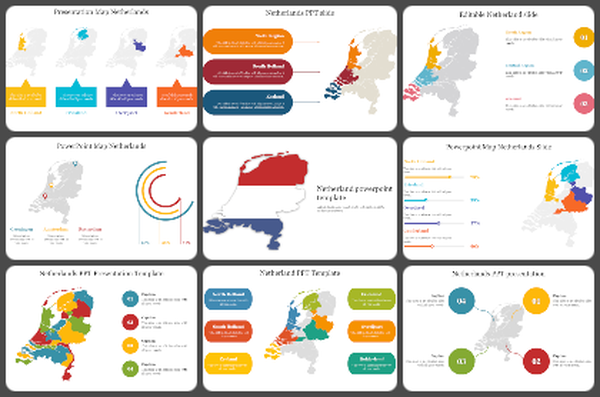
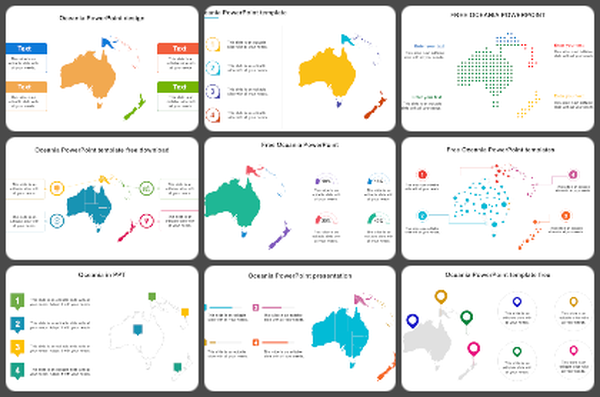
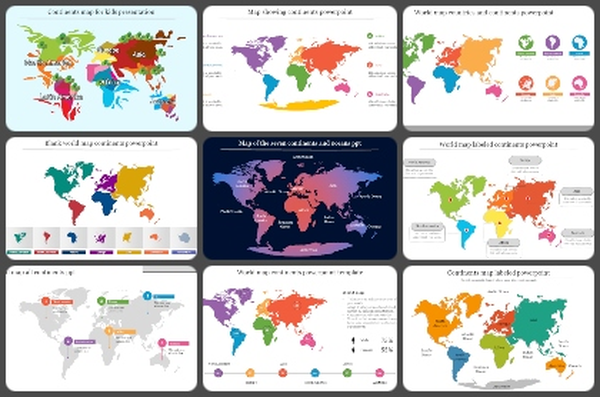
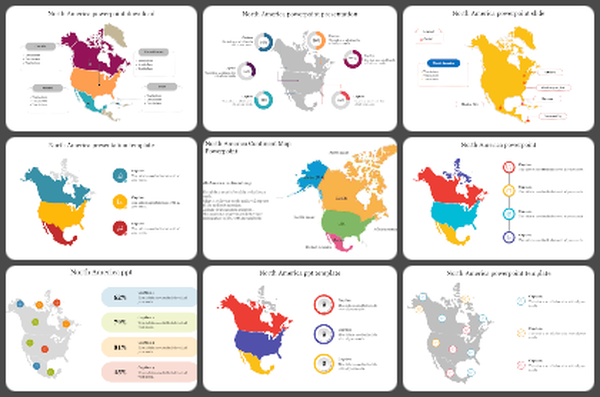
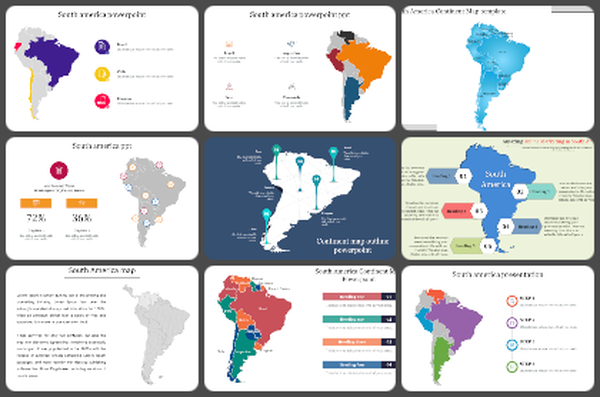
    Get our fully designed Brazil PowerPoint Template for PowerPoint. The map holds the pie charts to represent different regions in Brazil. This map slide will help you create a remarkable presentation without delay. It is well-designed and free to customize. Further, you can add colors to the map to highlight your data. They are useful for business and marketing representations. Since it is a pre-designed slide, it will save much of your valuable time. Get one from SlideEgg and see the difference. You can add location pins, graphics, and animations to enhance your presentation style.

    Features of the template

    • 100% customizable slides and easy to download.
    • Slides are available in different nodes & colors.
    • The slide contained 16:9 and 4:3 formats.
    • Easy to change the slide colors quickly.
    • It is a well-crafted template with an instant download facility.
    • Mind-blowing slide for the PowerPoint.
    • Best presentation slide.
    Advertisement

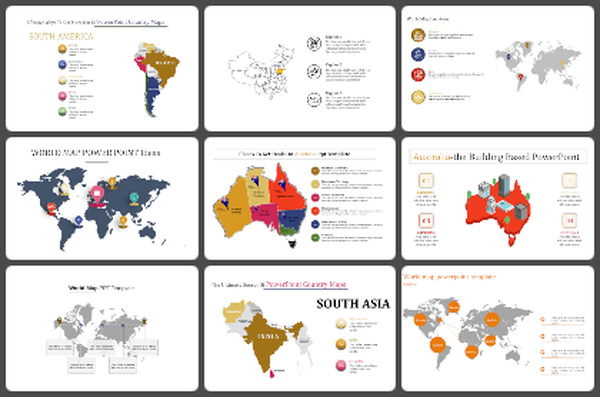
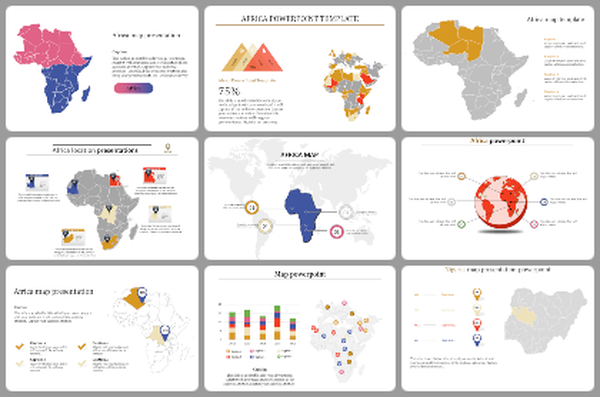
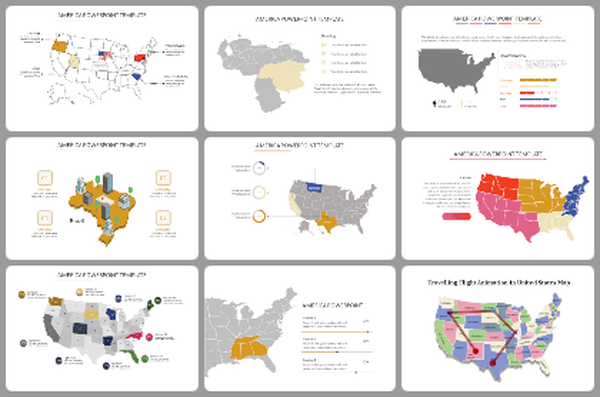
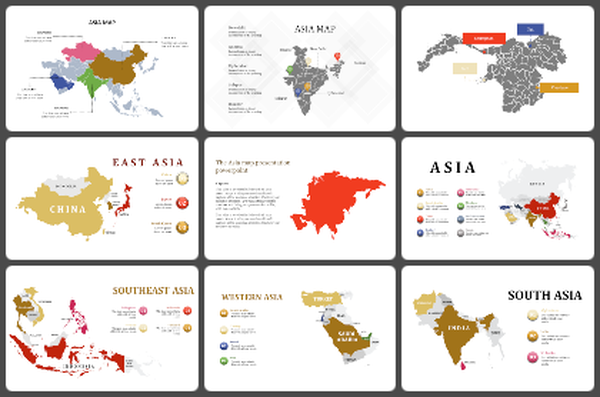
    You May Also Like These PowerPoint Templates

    Add to Wishlist
    Download
    AI Customize
    Brazil PowerPoint template highlighting regions from Roraima to Sao Paulo with colorful labels around a map.
    Add to Wishlist
    Download
    AI Customize
    Engaging and Exciting Brazil PowerPoint Design Themes
    Add to Wishlist
    Download
    AI Customize
    Gray map of Brazil with blue, yellow, red, and green text boxes linked to specific locations by thin arrows.
    Free
    Add to Wishlist
    Download
    AI Customize
    Buy bright and best Brazil PPT Template Free Download
    Add to Wishlist
    Download
    AI Customize
    Best Brazil PPT Download Template Design For Presentation
    Add to Wishlist
    Download
    AI Customize
    Brazil PowerPoint template showing a map with Brasilia marked, displaying population figures for 2010 and 2020.
    Add to Wishlist
    Download
    AI Customize
    Map of South America with Brazil highlighted in green, next to a Brazilian flag and an orange caption box on the right.
    Add to Wishlist
    Download
    AI Customize
    Map of Brazil with three regions highlighted in purple, blue, and green, paired with numbered text boxes on the left.
    Add to Wishlist
    Download
    AI Customize
    Gray Brazil map with colored connectors leading to pie charts representing percentages and labeled regions below.
    Free
    Add to Wishlist
    Download
    AI Customize
    Map of Brazil with four highlighted regions in orange, blue, red, and green, each linked to circular percentage diagrams.
    Add to Wishlist
    Download
    AI Customize
    Map of Brazil with colored dots representing data points, alongside four captions, with pie charts showing percentages.
    Add to Wishlist
    Download
    AI Customize
    Brazil PowerPoint presentation slide with a map of Brazil, highlighted in four colorful sections with space for text.
    Add to Wishlist
    Download
    AI Customize
    Brazil map infographic highlighting four regions using pie charts in purple, blue, green, and yellow.
    Add to Wishlist
    Download
    AI Customize
    Map of Brazil in blue and green shades, flanked by two circular charts showing male and female demographic percentages.
    Add to Wishlist
    Download
    AI Customize
    Gray map of Brazil with regions in purple, green, blue, orange, red, and pink, with matching text boxes on both sides.
    Add to Wishlist
    Download
    AI Customize
    Brazil Presentation PPT Slide For Business Presentation
    Add to Wishlist
    Download
    AI Customize
    Brazil map in maroon with 280m label, colorful bar chart indicating growth percentages, and four numbered sections.
    Add to Wishlist
    Download
    AI Customize
    Map of Brazil on the right with population in bold, bar chart with percentages on the right, and four placeholder text.