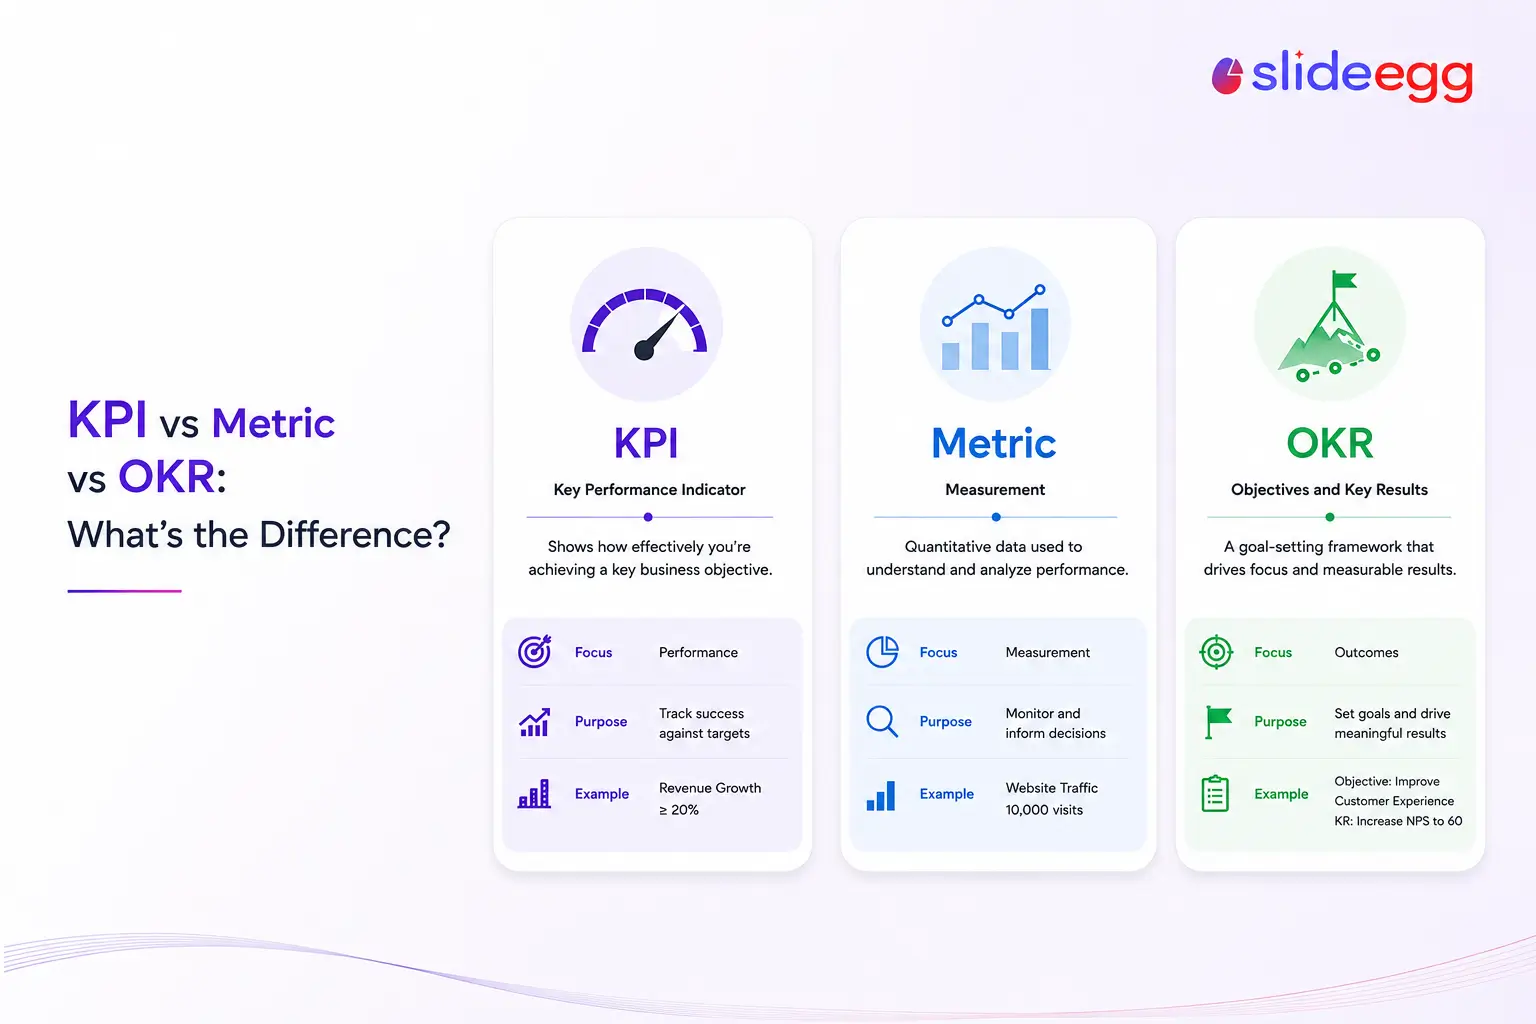
A metric is any number you measure. A KPI is a metric your organization considers important for judging performance against a goal. An OKR is a goal-setting framework that pairs an Objective with measurable Key Results that show whether the Objective was achieved. An existing KPI can sometimes serve as one of those Key Results.
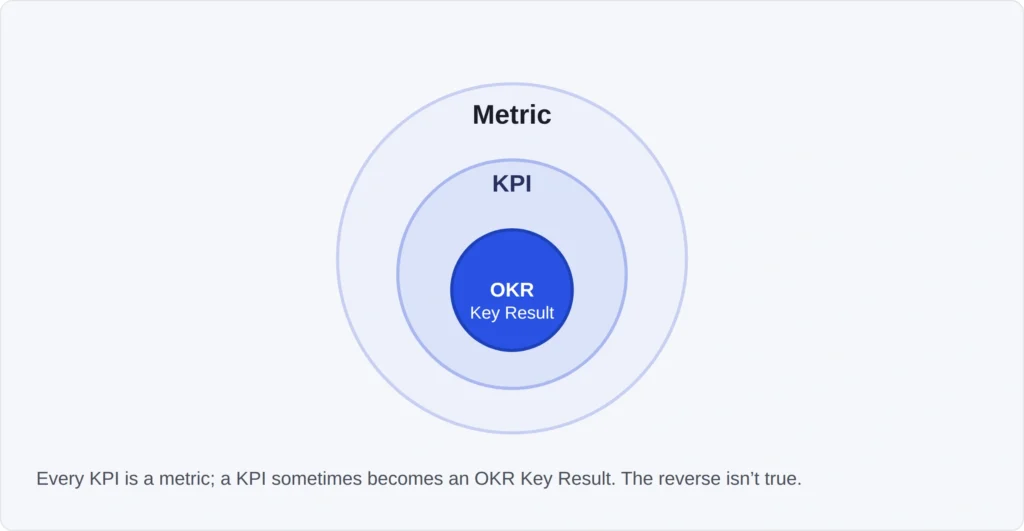
In short: every KPI is a metric, but not every metric is a KPI. KPIs and Key Results can overlap, but they aren’t interchangeable, and OKRs don’t replace ongoing KPI tracking.
That one-line answer solves most of the confusion. The rest of this article shows how the three actually connect, with one running example, so you can label your own numbers correctly and decide how each one fits into your team’s goal-setting and reporting process.
KPI vs Metric vs OKR at a Glance
| Metric | KPI | OKR | |
|---|---|---|---|
| What it is | Any measurable data point | A metric tied to a specific business goal | A goal (Objective) plus the measurable results that prove you hit it |
| Scope | Broad — hundreds can exist | Narrow — only the ones tied to strategy | Focused — a small number of Objectives per cycle, each usually backed by 3-5 Key Results |
| Time frame | Ongoing, no fixed deadline | Ongoing or reviewed on a recurring cadence | Fixed cycle, typically quarterly or annually |
| Owner | Often a system or department default | A specific team or role | A team or individual, reviewed with leadership |
| Example | Website page views | Conversion rate from lead to customer | Objective: “Grow qualified pipeline.” Key Result: “Increase lead-to-customer conversion from 8% to 12%.” |
What Is a Metric?
A metric is any quantifiable measurement of a business activity. It doesn’t have to matter strategically — it just has to be countable.
Page views, average handle time, number of tickets closed, email open rate, employee headcount — these are all metrics. Most businesses generate far more metrics than they could ever act on, because software tracks them automatically whether anyone asked for them or not.
Metrics become strategically important when they’re tied to a goal, but they can still provide useful diagnostic, operational, and contextual information before they ever become KPIs.
What Is a KPI?
A KPI (Key Performance Indicator) is a metric an organization has selected as important for judging performance against a specific business objective, usually evaluated against a target, threshold, or acceptable range.
The difference from a plain metric isn’t the number itself — it’s the decision around it. “Website page views” is a metric. “Increase organic page views by 20% this quarter to support the lead-gen goal” is a KPI, because it now has a target, a timeframe, and a reason it matters.
A useful KPI normally has a clear definition, an owner, a target or acceptable range, and a review cadence. What separates it from an ordinary metric isn’t a rigid checklist — it’s that the organization has identified it as important enough to judge performance against a meaningful goal.
What Is an OKR?
An OKR (Objectives and Key Results) is a goal-setting framework, not a single number. It pairs a qualitative Objective — what you want to achieve, written in plain language — with a small set of measurable Key Results — commonly three to five — that prove whether you achieved it.
The framework was developed by Andy Grove at Intel and later popularized at Google, where investor John Doerr introduced it — which is part of why OKRs are common in tech and startup environments today.
A typical OKR looks like this:
- Objective: Make onboarding painless for new customers.
- Key Result 1: Reduce time-to-first-value from 14 days to 5 days.
- Key Result 2: Increase 30-day product activation rate from 60% to 80%.
- Key Result 3: Cut onboarding support tickets by 25%.
An existing KPI can become a Key Result when improving it is directly tied to the Objective — “reduce time-to-first-value” and “increase activation rate” both work as KPIs on their own elsewhere in a business. Other Key Results are built specifically for the OKR and never operate as standalone KPIs at all. That’s the connection most comparisons skip.
How They Connect: One Number, Three Roles
Here’s the same underlying number moving through all three roles, using one sales team as the example:
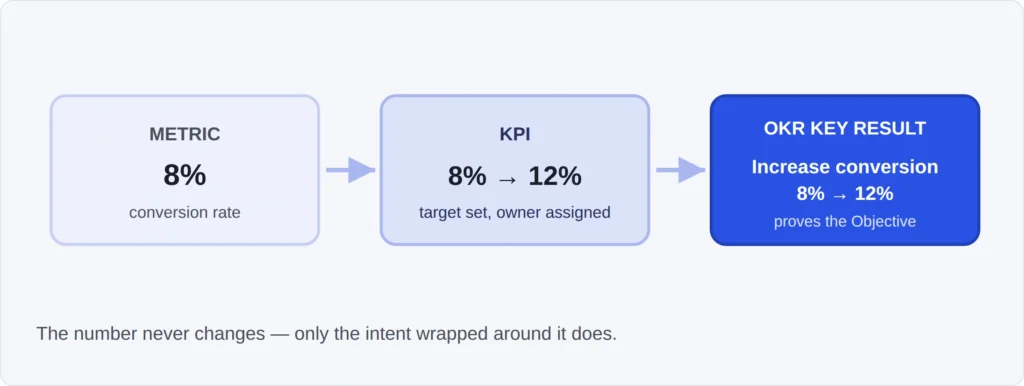
- As a metric: The team’s CRM tracks “lead-to-customer conversion rate” automatically. Right now it’s 8%. Nobody has decided it matters yet — it’s just a number the software happens to report.
- As a KPI: Leadership reviews the pipeline and decides conversion rate is the number that best reflects sales health this quarter. They set a target: “Increase conversion rate to 12% by the end of Q3.” It’s now a KPI — a metric with a target, an owner, and a reason it matters.
- Used as a Key Result within an OKR: The sales team sets a broader quarterly Objective — “Build a more predictable revenue pipeline” — and decides that same 8%-to-12% conversion target is a clear way to prove progress, so it becomes one of three Key Results, alongside things like “reduce average sales cycle from 45 to 30 days.”
Nothing about the number changed. What changed is the layer of intent wrapped around it — first none, then a target, then a target tied to a bigger strategic goal. That’s the whole relationship in one example.
Key Differences Between Metrics, KPIs, and OKRs
| Dimension | Metric | KPI | OKR |
|---|---|---|---|
| Requires a target? | No | Usually — a target, threshold, or acceptable range | Yes — measurable success criteria are defined through Key Results |
| Requires a deadline? | No | Usually | Always |
| Tied to strategy? | Not necessarily | Yes | Yes, explicitly |
| How many exist at once? | Dozens to hundreds | A handful per team | A small number of Objectives per cycle, each commonly backed by 3-5 Key Results |
| Reviewed how often? | Continuously, passively | On a set reporting cadence (weekly/monthly) | At cycle checkpoints (quarterly/annually) |
| Fails if… | It’s never actually a failure state — it’s just data | The target is missed | Progress is judged against the Key Results at the end of the cycle — expectations differ for committed vs. aspirational OKRs |
Which One Should You Set Up First?
There isn’t one required sequence — start with whatever problem your team actually has.
- If you lack reliable measurement: define the metrics first. You can’t prioritize what you haven’t measured yet.
- If you already track plenty of data but don’t know what matters: identify the small set of metrics that best reflect meaningful performance, define how each should be evaluated, and assign appropriate targets or ranges. Those are candidates for your KPIs.
- If the team understands current performance but needs focus around what should change next: define an Objective and the measurable Key Results that would prove it happened. Relevant KPIs can then inform or become those Key Results when they directly support the Objective.
Two failure patterns show up regardless of where you start. One is writing an Objective without defining measurable Key Results that show what success means — “improve customer satisfaction” can work fine as an Objective, but without Key Results such as a target NPS, a retention rate, or a response-time improvement, the OKR is incomplete. The other is tracking dozens of KPIs that never connect to a stated Objective, which tends to produce a crowded dashboard nobody checks. The goal is alignment between the three, not a mandatory build order.
Metric, KPI, and OKR Examples by Department
The examples below are a starting point for four common departments — not an exhaustive list.
Sales
- Metric: Number of outbound calls made
- KPI: Lead-to-opportunity conversion rate, targeted at 25%
- Objective: Build a repeatable outbound motion.
- Key Result: Raise lead-to-opportunity conversion from 18% to 25% this quarter.
Marketing
- Metric: Blog page views
- KPI: Marketing-qualified leads (MQLs) generated per month, targeted at 200
- Objective: Make content a reliable pipeline source.
- Key Result: Grow MQLs from content from 120 to 200 per month.
HR
- Metric: Number of open positions
- KPI: Average time-to-hire, targeted at under 30 days
- Objective: Strengthen the hiring pipeline for engineering.
- Key Result: Cut average time-to-hire from 45 to 30 days.
Operations
- Metric: Number of support tickets opened
- KPI: First-response time, targeted at under 2 hours
- Objective: Deliver a faster, more reliable support experience.
- Key Result: Reduce average first-response time from 5 hours to 2 hours.
Common Mistakes to Avoid
- Calling every tracked metric a KPI. A KPI is not simply any number on a dashboard. It should represent a measure the organization considers important for judging performance against a meaningful goal, usually with a target, threshold, or acceptable range. Dashboards with 40 “KPIs” usually mean nobody actually decided which numbers matter.
- Writing OKRs with no measurable key result. “Improve team morale” is an Objective with no Key Result attached. Without a number and a deadline, it can’t be tracked and it isn’t an OKR yet — it’s a wish.
- Setting KPI targets with no baseline. A target like “increase conversion rate” means nothing without the current number attached. Every KPI needs a starting point, not just a destination.
- Tracking too many Objectives at once. Teams that run 10+ Objectives per quarter dilute focus until none of them get real attention. Keeping the number of Objectives small helps preserve focus; each one is commonly supported by three to five Key Results.
- Confusing a vanity metric for a KPI. Social media followers or app downloads feel good to report but often don’t connect to revenue or retention. Before promoting a metric to KPI status, confirm it has a meaningful connection to a business goal or critical performance outcome, rather than measuring activity for its own sake.
These are the terminology mistakes — the ones that happen before a number ever reaches a slide.
Turning These Numbers Into a Report People Actually Read
Once you know which numbers are metrics, which are KPIs, and which are feeding into an OKR, the next problem is usually presentation — getting the right numbers in front of the right people without burying the KPI that matters inside a wall of raw metrics.
A few practical rules hold across departments. Put KPIs on their own slide or panel, separate from background metrics, so leadership isn’t scanning for the number that actually has a target attached.
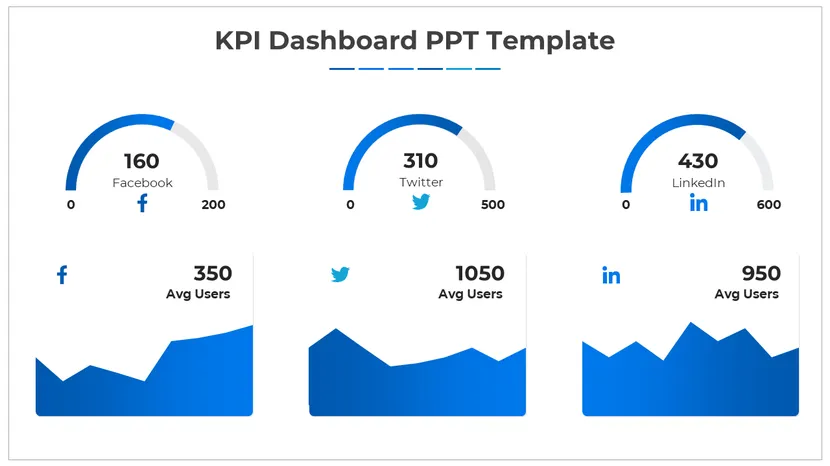
Source: Free KPI Dashboard PPT Template — view and download on SlideEgg
Show the target next to the current number, not just the current number alone — a KPI shown without its target or benchmark loses the context executives need to judge whether performance is on track.
When reporting OKR progress specifically, show the Objective once at the top and let each Key Result appear underneath it with its own progress indicator, so the connection between the goal and the numbers proving it stays visible.
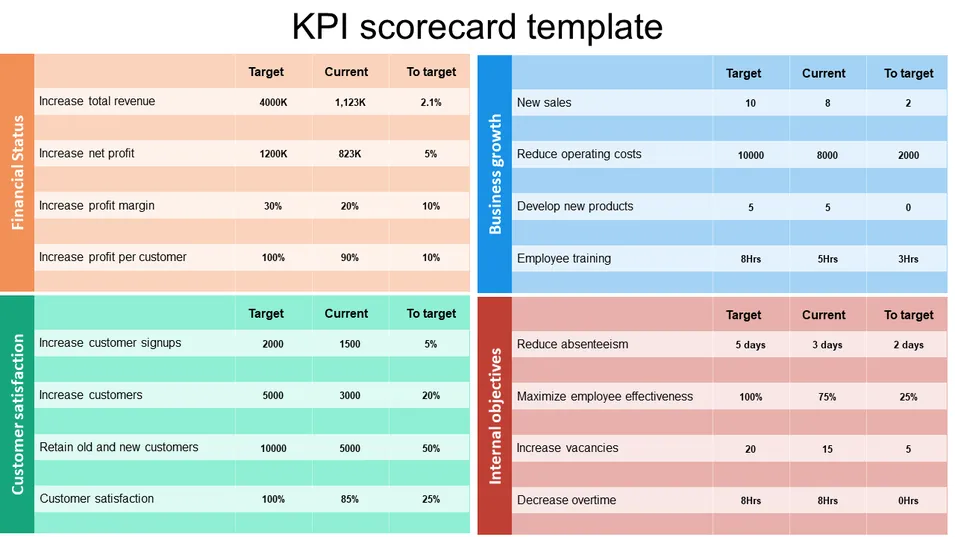
Source: KPI Scorecard Template — view and download on SlideEgg
If you’re building that kind of reporting deck from scratch, a KPI PowerPoint template with a target-vs-actual layout built in saves you from designing that structure yourself.
For quarterly goal reviews specifically, an OKR PowerPoint template keeps the Objective-to-Key-Result hierarchy visually clear instead of flattening it into a bullet list.
Choosing the right numbers and laying them out cleanly gets you most of the way there.
FAQs
Is a KPI a type of metric?
Yes. Every KPI is a metric, but not every metric is a KPI. A KPI is a measure the organization has identified as important for judging performance against a meaningful goal, and it’s commonly evaluated against a target, threshold, or acceptable range.
Can a KPI be a key result in an OKR?
Yes, when the two line up. An existing KPI can become a Key Result if improving it is directly tied to the Objective — “increase conversion rate from 8% to 12%” can work as both. Other Key Results are built specifically for that OKR and don’t exist as standalone KPIs anywhere else.
How many KPIs should a team track?
There’s no universal number. A team should track only the KPIs needed to judge its most important areas of performance. If the list gets so long that every dashboard metric is called a KPI, the term has lost its purpose.
What’s the difference between a leading and lagging metric?
A leading metric signals progress toward a future outcome (like number of demos booked, which points toward future sales), while a lagging metric measures a result that’s already occurred (like closed revenue). Both can become KPIs, but leading metrics let you course-correct earlier because they show a problem before the final result comes in.
Do OKRs replace KPIs?
No. KPIs monitor important aspects of ongoing performance, while OKRs focus a team on specific outcomes it wants to achieve during a defined cycle. An existing KPI can serve as a Key Result when it directly measures progress toward the Objective, but many Key Results are created specifically for that OKR.
What’s a north star metric, and is it a KPI?
A north star metric is a high-level measure intended to capture the core value customers get from a product and signal sustainable long-term growth (for example, “weekly active users” for a software company). It can function like a company-level KPI, while individual teams still use their own supporting KPIs to manage day-to-day performance.
The Bottom Line
Metrics are the measurements you track. KPIs are the small set of measures your organization has decided are important enough to judge performance against a goal. OKRs define what you want to achieve and the measurable Key Results that show whether you achieved it — an existing KPI can serve as a Key Result when it directly supports the Objective, but it doesn’t have to.
If you’re setting this up for the first time, start with whichever piece is missing. Usually that means picking the metrics that most directly reflect whether your team is succeeding, giving the important ones a target, and grouping the ones tied to a bigger priority under a clear Objective. Once you know what you’re tracking and why, reporting it clearly is the easier half of the job.
Continue Reading: KPI Series
- KPI Examples: The Most Common KPIs by Department: See a fuller breakdown of KPIs by team, beyond the four examples above.
- How to Choose the Right KPIs to Put on a Slide: A deeper walkthrough of narrowing a full dashboard down to what’s worth a slide.
- 7 KPI Dashboard Mistakes That Confuse Executives: The dashboard-specific mistakes that show up after your terminology is already right.
- How to Present KPIs So They Tell a Story: Turning layout and numbers into a narrative your audience acts on.