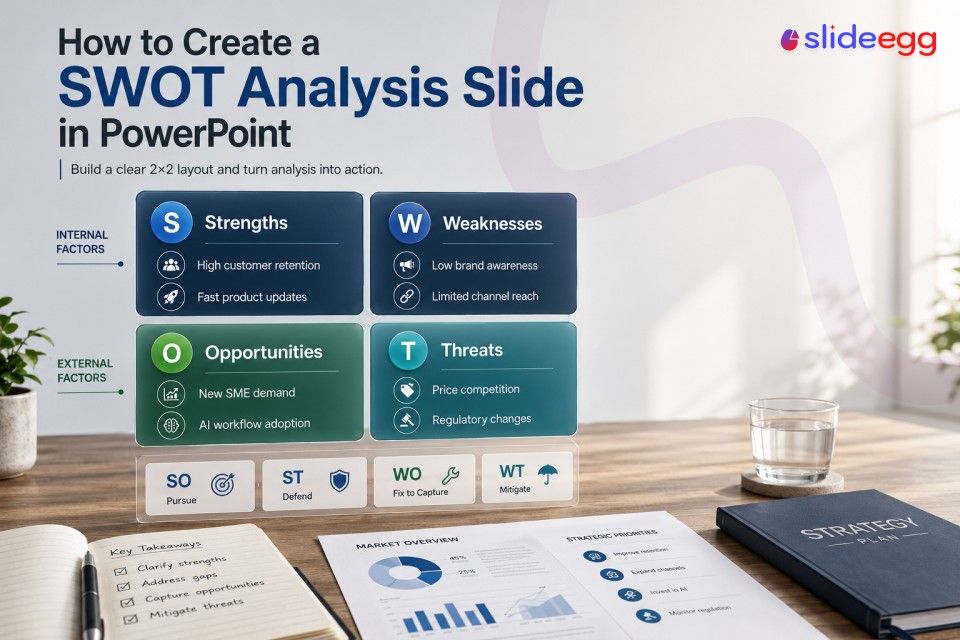
Most SWOT slides get filled with vague statements that no one acts on. This guide shows you how to write entries that hold up under scrutiny — and how to turn your 2×2 grid into a strategy matrix that drives real decisions.
Quick Answer
To create a SWOT analysis slide in PowerPoint: open a new slide, insert a 2×2 table (Insert → Table → 2 columns, 2 rows), resize each cell to equal height, and label the quadrants Strengths, Weaknesses, Opportunities, and Threats. Fill each box with 3–5 specific, evidence-based points — avoid vague statements like “strong team.” Add color fills to distinguish internal factors (Strengths/Weaknesses) from external ones (Opportunities/Threats). When done, use the SO/ST/WO/WT strategy matrix below to convert your analysis into concrete next steps.
How to Build the SWOT Slide in PowerPoint (Step by Step)
Once your entries are written, the build is straightforward. These steps work in PowerPoint 2016 and later, including Microsoft 365.
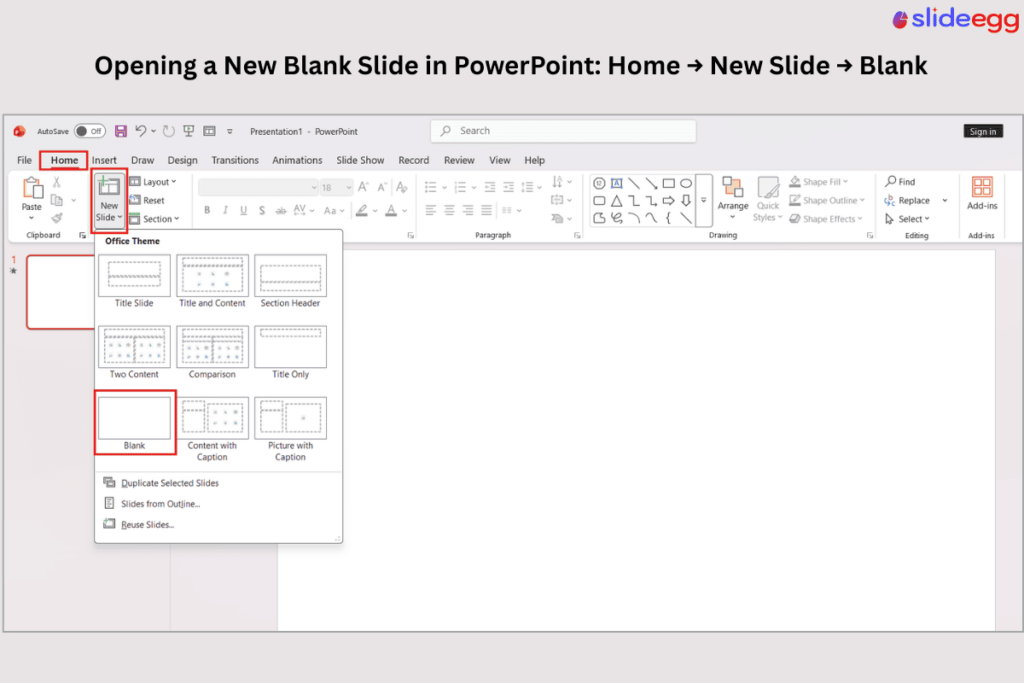
1. Open a new blank slide – Ctrl + M
Start with a blank layout, not a content placeholder layout. A SWOT grid needs the full slide real estate. Go to Home → New Slide → Blank, or press Ctrl + M and then change the layout.
2. Add a title text box at the top
Insert a text box (Insert → Text Box), click near the top of the slide, and type your title: “SWOT Analysis — [Company/Product Name]”. Keep it to one line. Set font size to 20–24pt, bold, and align left. Leave about 0.5 inches of margin from the slide edge.
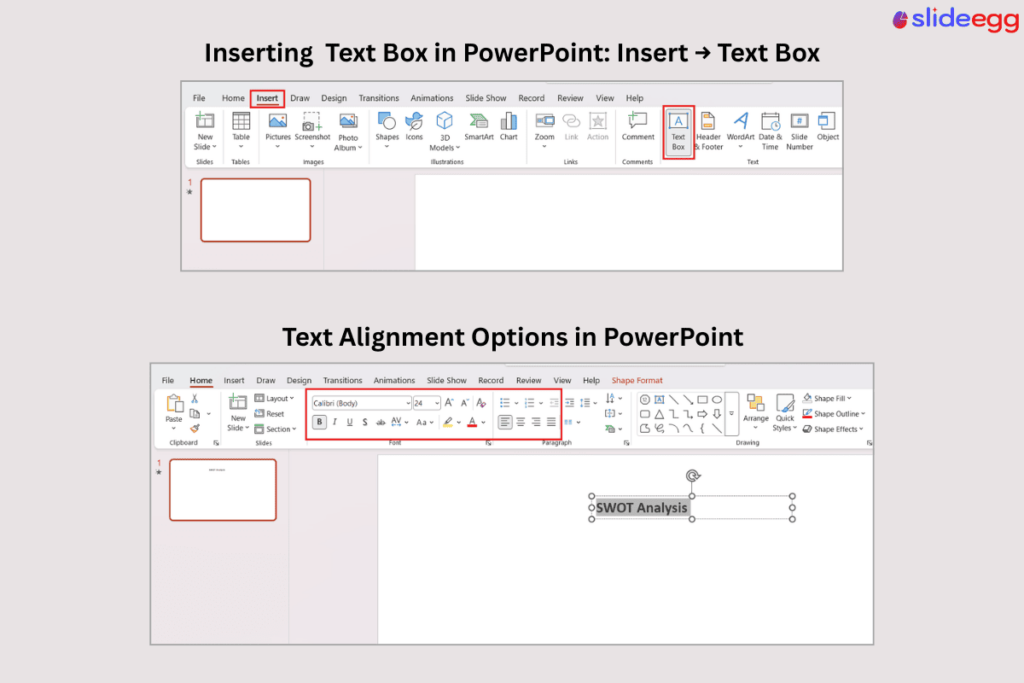
3. Insert a 2×2 table for the grid
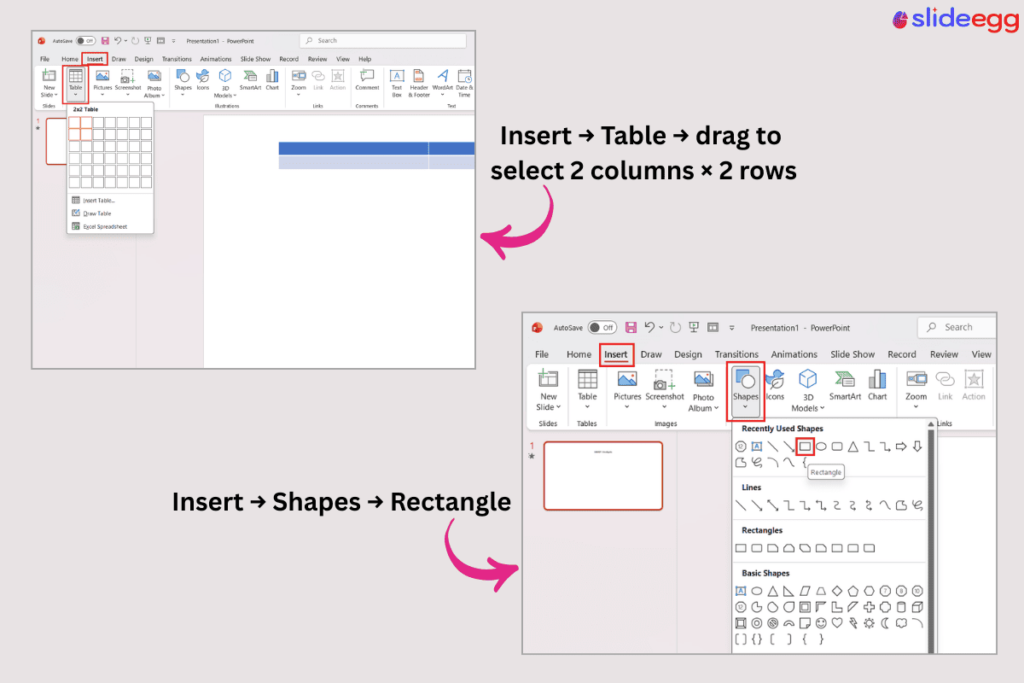
Go to Insert → Table → drag to select 2 columns × 2 rows. Click to insert. Don’t worry about size yet — you’ll resize it in the next step.
Alternative: If you want more design control, skip the table and use four equal rectangles (Insert → Shapes → Rectangle). Arrange them in a 2×2 grid with a 4px gap between them. This gives you more control over rounded corners and individual cell styling.
4. Resize the table to fill the slide: Shift + drag
Click the table, then drag its handles to fill the slide from below the title to the bottom margin. Aim for roughly equal row heights. To set exact heights: right-click the table → Table Properties → Row → set a fixed row height.
5. Label and color the quadrants
Click inside each cell and type the quadrant name (Strengths, Weaknesses, Opportunities, Threats) on the first line, then add your entries below it. To add background color: click a cell, go to Table Design → Shading.
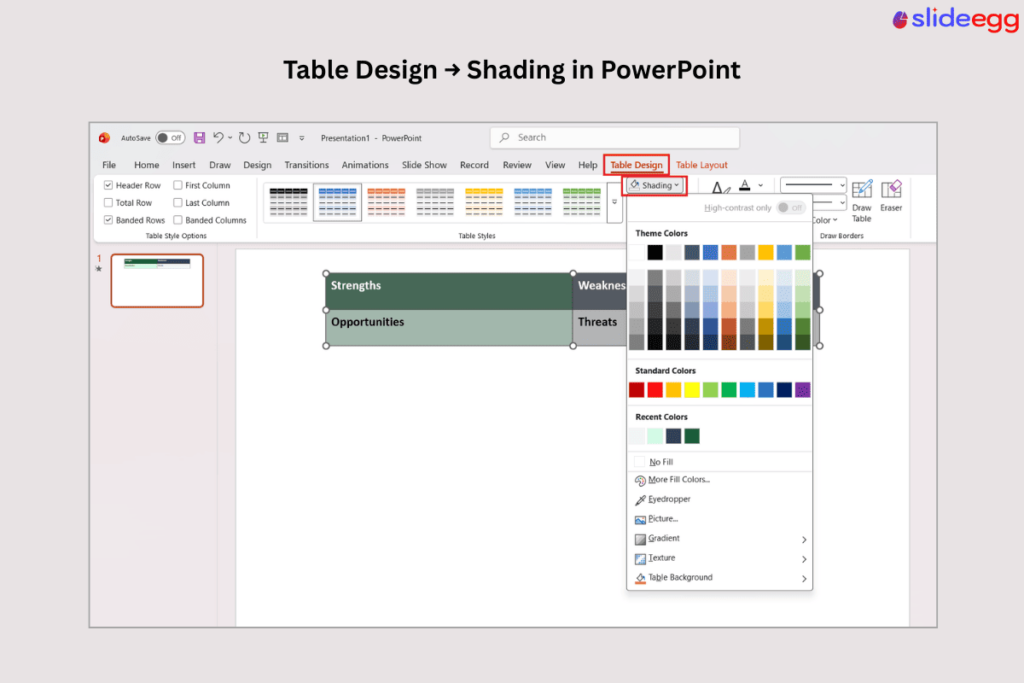
Suggested fills:
Strengths: Dark green (#1a5c3a) with white text | Weaknesses: Dark slate (#334155) with white text | Opportunities: Light green (#d1fae5) with dark text | Threats: Light gray (#f1f5f9) with dark text
6. Format the text inside each cell
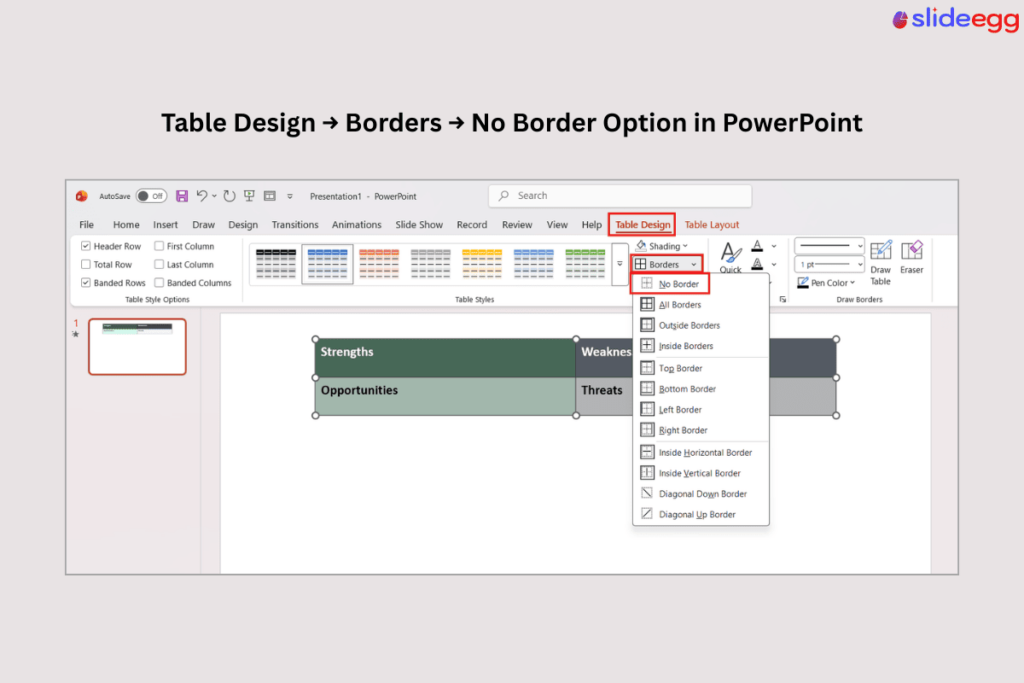
Use a two-level text structure inside each cell: the quadrant name in bold at 14–16pt, then your bullet points at 11–13pt. Remove default table borders if they clash with your color fills — go to Table Design → Borders → No Border, then manually add thin white internal borders if needed.
7. Add axis labels above and beside the grid
Two small text labels help orient the audience quickly: one above the grid reading “Internal / External” aligned to the two columns, and one on the left side reading “Helpful / Harmful” rotated 90°. These are optional but improve readability for audiences seeing a SWOT for the first time.
8. Review for visual balance: Ctrl + Shift + G
Each cell should have roughly the same amount of text. If one quadrant has 6 items and another has 2, either trim or add — uneven entries signal that the analysis itself is incomplete. Use Ctrl + Shift + G to ungroup elements if needed for alignment tweaks.
Aim for 3–5 entries per quadrant. More than 5 usually means some entries are duplicates or sub-points of others.
If you’d rather start from a formatted layout than build from a blank slide, browse SWOT PowerPoint templates — select a layout with the color scheme and quadrant proportions that match your presentation style, then replace the placeholder entries with your own researched content.
Why Most SWOT Slides Fail Before You Even Present Them
Building a SWOT slide isn’t technically difficult. PowerPoint has the shapes, the templates exist, and the four-box format is familiar to every audience. The problem is almost never the layout. The problem is what goes inside the boxes.
After sitting through hundreds of strategy reviews, the same failure patterns appear in SWOT slides across industries. If your slide has any of these symptoms, your audience will mentally check out by the second quadrant.
The four most common SWOT slide failure modes:
👥 Vague Affirmations
Strengths that could apply to any company. These entries don’t inform decisions because they carry no specific evidence.
“Experienced team” / “Good customer relationships” / “High-quality products”
🔂 Recycled Industry Noise
Opportunities and Threats copied from industry reports, not anchored to your specific situation or time horizon.
“AI is disrupting the market” / “Growing middle class in emerging markets”
🌞 No Strategy Follow-Through
The SWOT fills one slide, then the presentation moves on. The four quadrants never connect to a plan.
A SWOT slide followed immediately by a product roadmap with no visible link between them.
⚖️ Weaknesses Softened to Nothing
The Weaknesses box gets treated as politically dangerous, so it fills up with non-threatening non-answers.
“Room for improvement in some areas” / “Still growing our brand awareness”
A SWOT analysis slide only earns time in a presentation if each entry is specific enough to be debated. If your audience can read a strength and nod without thinking, it’s not doing its job.
What Each Quadrant Is Actually Asking
Before you open PowerPoint, get clear on what each box is trying to surface. The four quadrants split across two axes: internal vs. external factors, and helpful vs. harmful to your objective.
| ◀ Internal | External ▶ |
|---|---|
| Strengths Internal capabilities that give you a real advantage over competitors right now. Ask: What do we do better than anyone else — and can we prove it with data? | Weaknesses Internal limitations that put you at a disadvantage or slow your growth. Ask: What would a well-funded competitor exploit about us in the next 12 months? |
| Opportunities External conditions — market, regulatory, competitive — that you can move to capture. Ask: What external shift is creating a window that didn’t exist 18 months ago? | Threats External forces — competitors, regulations, market changes — that could harm your position. Ask: What external development, if it accelerated, would most damage our revenue? |
The “Ask” prompts in each cell are the filter for deciding whether an entry belongs.
Use those four questions as an entry-quality test. If a bullet point can’t answer the question in its quadrant, it either belongs in a different box or needs to be rewritten.
What Good Entries Look Like (With Examples)
Specificity is the single variable that separates a useful SWOT from a decoration. Here’s what that looks like across all four quadrants.
| Strengths: Internal / Helpful | |
| ✕ Vague — Cut This “Strong brand reputation in our industry” This could describe 40% of companies. No metric, no comparison, no time frame. An audience can’t act on it. | ✓ Specific — Keep This “Highest NPS in our category (72 vs. industry avg 44) for three consecutive quarters” Quantified, benchmarked, time-bounded. The audience immediately understands the advantage and its magnitude. |
| Weaknesses: Internal / Harmful | |
| ✕ Vague — Cut This “Limited digital presence compared to competitors” Too broad to address. Which platform? How limited? Competitors — plural — means no one is accountable for closing the gap. | ✓ Specific — Keep This “Organic search traffic is 60% below the segment leader; our top 3 commercial pages rank outside the top 20” Specific gap, specific channel, named benchmark. A team can immediately identify what to fix and measure progress. |
| Opportunities: External / Helpful | |
| ✕ Vague — Cut This “Growing demand for sustainability-focused products” True for most industries right now. Without a geographic or segment focus, it’s background noise, not an actionable opportunity. | ✓ Specific — Keep This “EU mandatory ESG reporting rules (effective FY2025) create demand for compliance tooling in our target SME segment — no category leader yet” Triggered by a specific regulatory event, time-bounded, segment-specific, and identifies a competitive gap. |
| Threats: External / Harmful | |
| ✕ Vague — Cut This “Increased competition from new market entrants” Everyone faces this. It tells the audience nothing about timeline, severity, or which parts of the business are exposed. | ✓ Specific — Keep This “Competitor X launched a lower-priced tier in Q1; our mid-market segment (42% of revenue) now has direct price pressure for the first time” Named competitor, specific revenue exposure, quantified segment risk. The audience immediately knows this is worth a contingency plan. |
Rule of thumb: if you can replace the company name in an entry and it still reads as true for a competitor, the entry isn’t ready yet.
Turning Your SWOT Into a Strategy Matrix
A SWOT slide that ends at four filled quadrants is analysis, not strategy. The step that most presentations skip is combining the quadrants into actionable positions — what strategists call the TOWS matrix.
The idea is straightforward: pair each internal factor with each external factor to generate four types of strategic response. This is what gives the SWOT slide a reason to exist beyond the opening diagnostic.
| TOWS Matrix | External Opportunities | External Threats |
|---|---|---|
| Internal Strengths | SO — Pursue Use your strengths to capture available opportunities. These are your highest-priority growth moves. What can we do right now, with existing advantages, to take ground? | ST — Defend Use your strengths to reduce the impact of external threats. What advantages do we hold that can act as a buffer if the threat accelerates? |
| Internal Weaknesses | WO — Fix to Capture Address weaknesses that are preventing you from capturing an opportunity. What would we need to fix internally to be positioned to move on this? | WT — Mitigate Minimize exposure where internal weaknesses overlap with external threats. These are your highest-risk scenarios — monitor them, and plan for contingency. |
Add a second slide immediately after your SWOT grid that maps 2–3 specific actions from this matrix to each strategic position. This transforms the analysis into a decision record — useful for teams reviewing strategy in six months.
The SO quadrant should drive your near-term priorities. The WT quadrant should inform your risk register. The WO and ST quadrants become your medium-term capability and defensive roadmaps respectively.
Three Design Rules for a SWOT Slide That’s Easy to Read
Rule 01: Limit bullets to one line each
Each SWOT entry should be read as a single line of 8–12 words. If an entry needs two lines to be clear, it’s either poorly written or trying to say two things at once. Tighten it or split it.
Rule 02: Use color to separate internal from external
Color the two internal quadrants (Strengths, Weaknesses) with darker fills and the two external quadrants (Opportunities, Threats) with lighter fills — or vice versa. This reinforces the axis logic visually without needing a label.
Rule 03: Keep it to one slide
A SWOT that overflows to a second slide has too many entries. Ruthlessly cut to the 3–5 most material points per quadrant. A SWOT is a diagnostic summary, not a research dump.
Frequently Asked Questions
How many items should go in each SWOT quadrant?
Three to five per quadrant is the practical limit for a single slide. Fewer than three suggests the analysis is underdeveloped; more than five usually means the entries haven’t been prioritized. If you have a long list, rank by impact and cut everything below the top five. Your audience doesn’t need an exhaustive inventory — they need to know what matters most.
Should Strengths and Weaknesses always be internal factors?
Yes. Strengths and Weaknesses describe factors within your organization’s control — capabilities, resources, processes, and people. If a factor is shaped by market conditions, competitors, or regulation, it belongs in Opportunities or Threats. The internal/external split is not just organizational preference; it determines what kind of strategic response is possible. You can address a weakness. You can only respond to a threat.
Does PowerPoint have a built-in SWOT template?
PowerPoint does not include a dedicated SWOT slide in its built-in templates, but you can find SWOT layouts through File → New → search “SWOT” to pull from Microsoft’s online template library. Results are limited in design quality. For presentation-ready layouts with more visual options, you can also download a free SWOT analysis PowerPoint template and edit the existing quadrant structure with your own content instead of building from scratch.
What’s the difference between a SWOT and a TOWS matrix?
A SWOT lists factors across four categories. A TOWS matrix takes those same factors and combines them in pairs — Strengths + Opportunities, Strengths + Threats, Weaknesses + Opportunities, Weaknesses + Threats — to generate specific strategic responses. The SWOT is a diagnostic tool. The TOWS is a strategy tool. If your presentation ends at the SWOT without building the matrix, you’ve done half the work.
Can I use a SWOT slide for a personal career review, not just a business?
Yes. A personal SWOT follows the same structure but scopes each quadrant differently: Strengths are skills, credentials, and experience you have now; Weaknesses are skill gaps or habits that limit your growth; Opportunities are market demand, industry shifts, or open roles; Threats are things like automation risk, credential competition, or sector decline. The same entry-quality rules apply — be specific and honest about the Weaknesses box in particular.