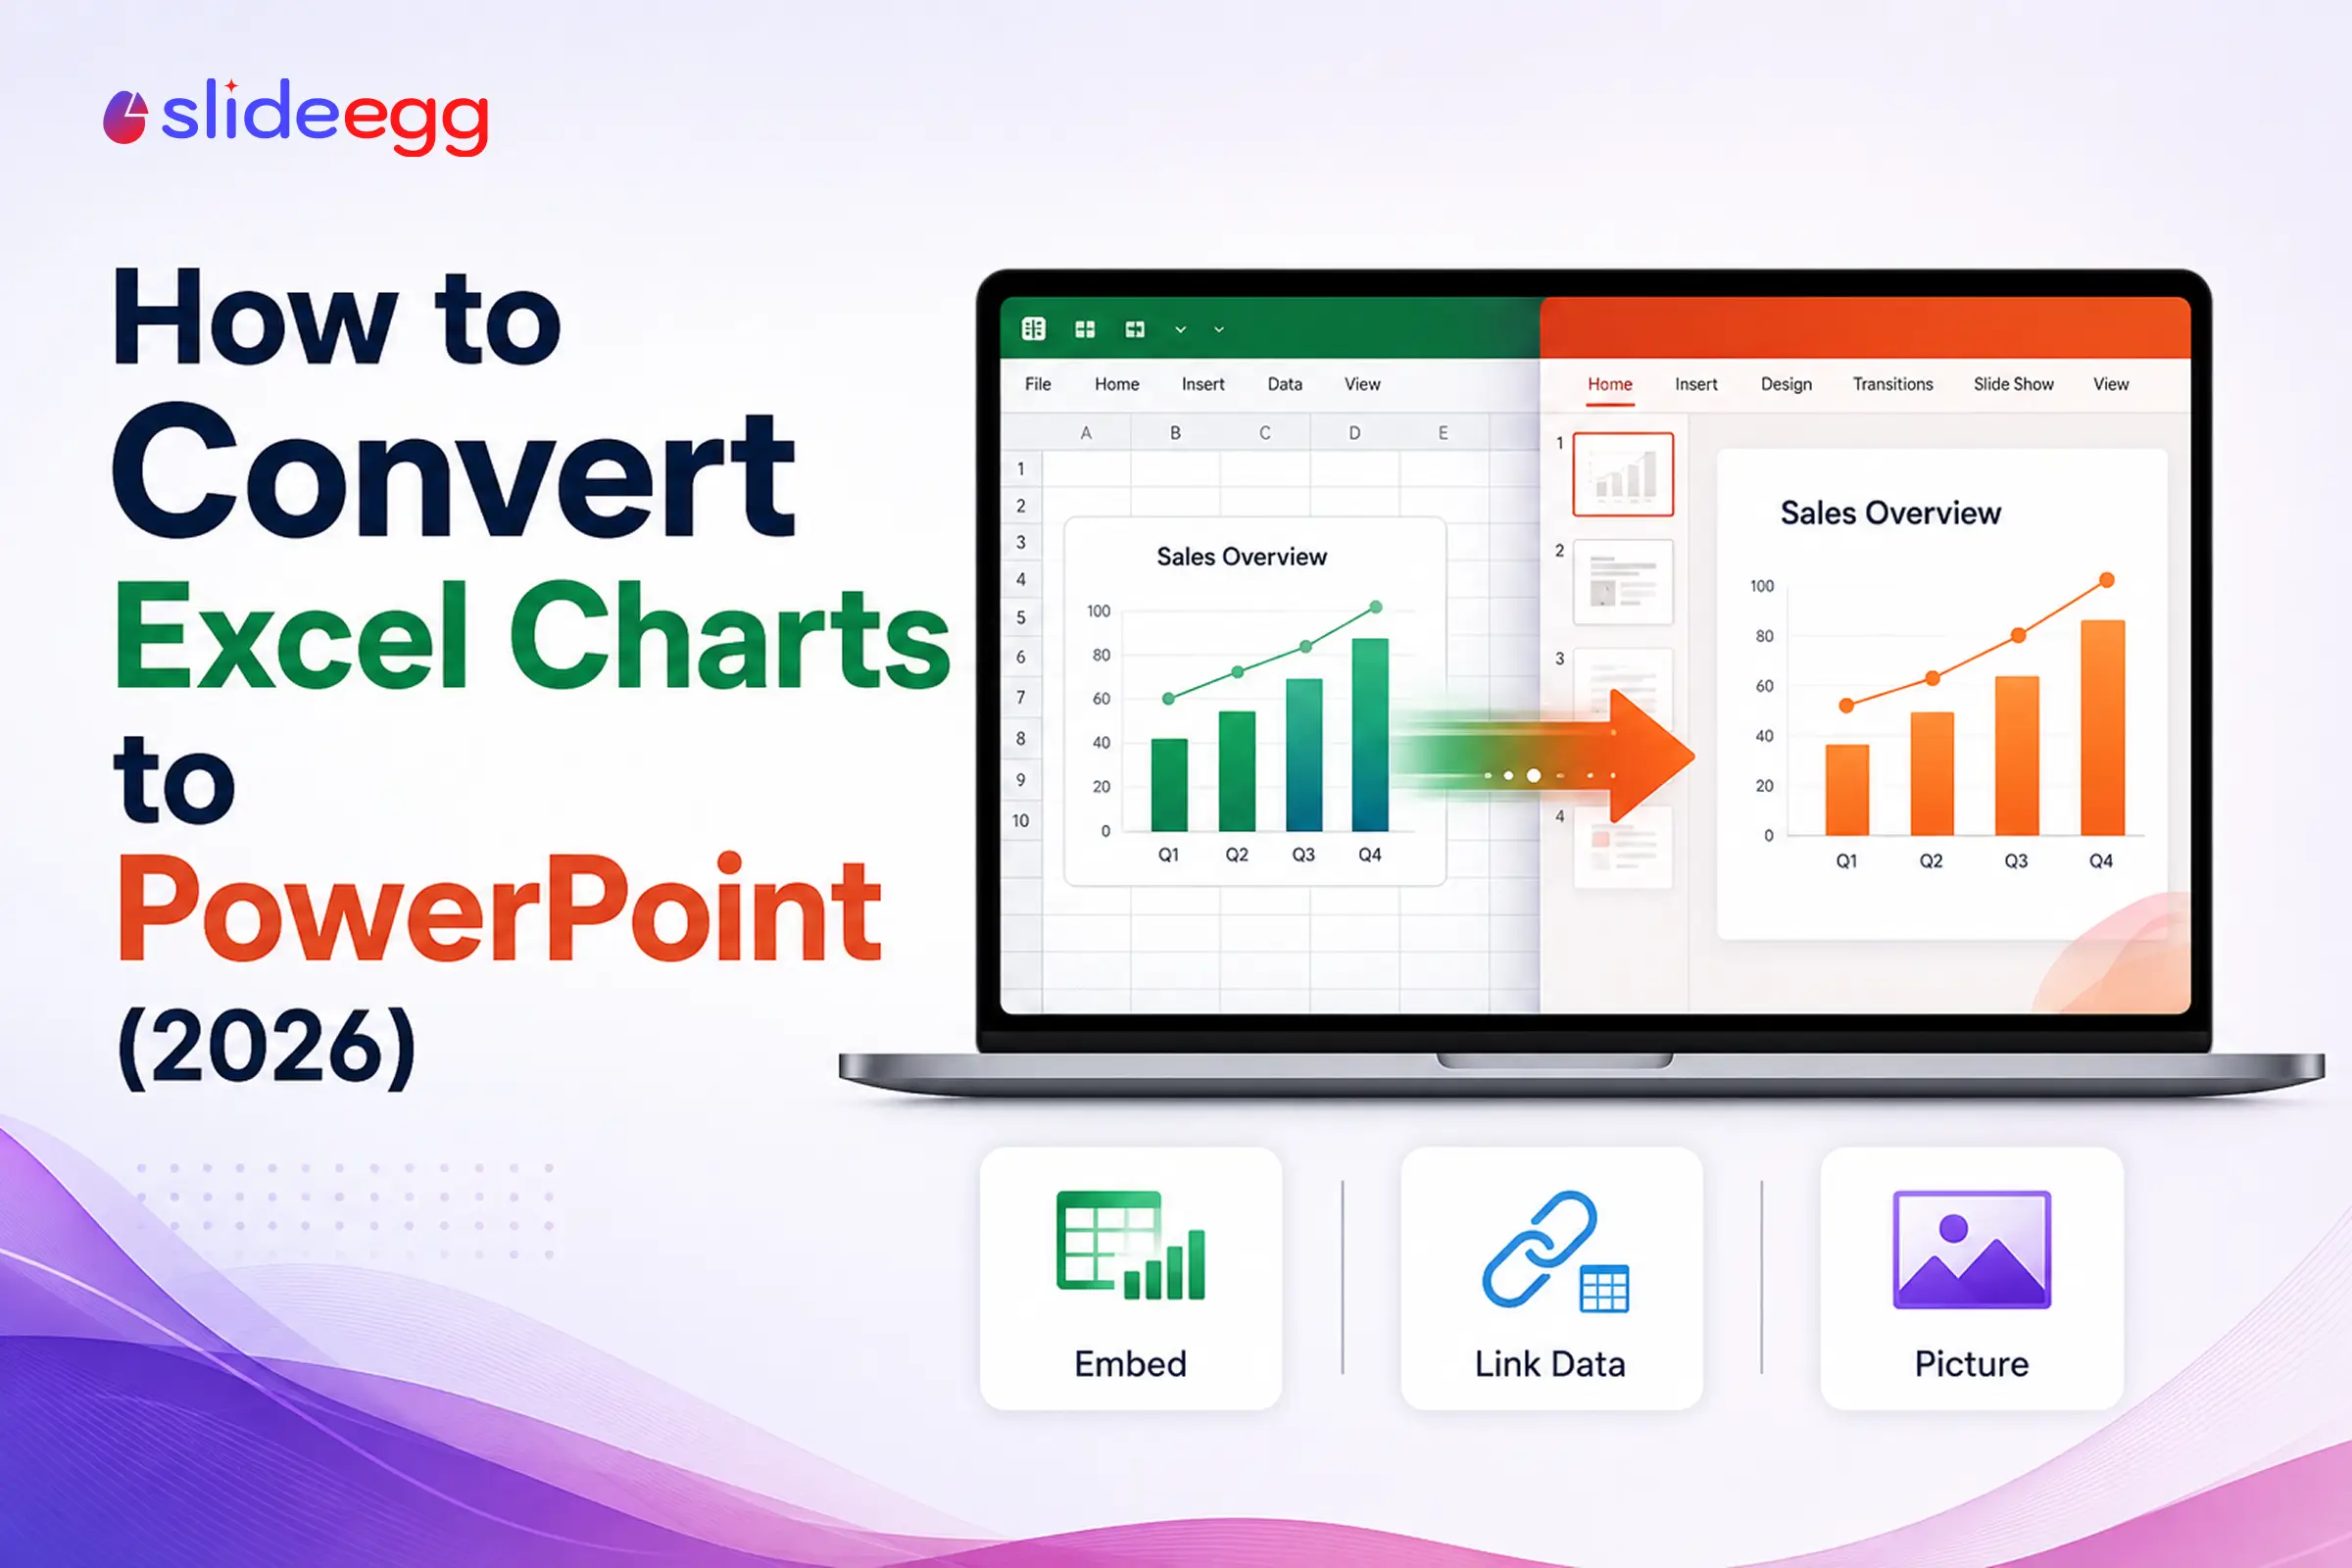
An Excel chart doesn’t really “convert” into PowerPoint—you copy it across, and the one decision that matters is whether it stays linked to your live data or becomes a fixed snapshot. You make that call the moment you paste, and it controls whether the chart updates on its own, how large your file gets, and whether you can still edit it later.
Get that choice right and everything else falls into place. This guide explains when to embed, link, or paste as a picture, walks through the exact steps for each, and covers the mistakes that leave you with broken charts, stale numbers, or a bloated deck.
How to Add an Excel Chart to PowerPoint (Quick Steps)
- In Excel, click the chart and press Ctrl + C (⌘ + C on Mac).
- In PowerPoint, click the slide and press Ctrl + V.
- Click the Paste Options button next to the chart.
- Choose Embed, Link Data, or Picture.
- Resize the chart and match it to your slide’s colors and fonts.
Embed, Link, or Picture: Which Should You Choose?
This is the real decision. All three put the chart on your slide, but they behave very differently afterward.
| Option | Updates from Excel? | File size | Best for |
|---|---|---|---|
| Embed | No—update by hand | Larger | One self-contained file you can share anywhere |
| Link Data | Yes, when the Excel file changes | Smaller | Data that keeps changing and stays on your computer |
| Picture | No—it’s a static image | Smallest | A final, locked snapshot you won’t edit |
A quick rule: embed when you’ll email the deck, link when the numbers still change, and picture when the chart is final and you want it safe.
How to Copy an Excel Chart into PowerPoint
Copy and paste is the method most people want. In Excel, click the chart and press Ctrl + C. In PowerPoint, click the slide and press Ctrl + V.
A Paste Options button appears near the chart. Click it to pick one of five choices:
| Paste option | What it does |
|---|---|
| Use Destination Theme & Embed Workbook | Default. Recolors the chart to match your PowerPoint theme; data is embedded. |
| Keep Source Formatting & Embed Workbook | Keeps the chart’s Excel look exactly; data is embedded. |
| Use Destination Theme & Link Data | Matches your PowerPoint theme and links to the Excel file, so it updates. |
| Keep Source Formatting & Link Data | Keeps the Excel look and links to the file, so it updates. |
| Picture | Pastes a static image. Can’t be edited or updated, but you can style it. |
For most decks, the default (Use Destination Theme & Embed Workbook) is the safe pick—the chart matches your slides and the file works anywhere.
On a Mac, the same options appear, but you’ll usually find them under Edit > Paste Special or the small paste menu rather than a floating button. Paste Special (in Home > Paste > Paste Special on Windows) is also the route to use if you want to paste the chart as a specific format, such as a PNG or an enhanced metafile.
How to Link an Entire Excel Worksheet
If you want the chart tied to a live worksheet, you can link the whole file instead of pasting a single chart.
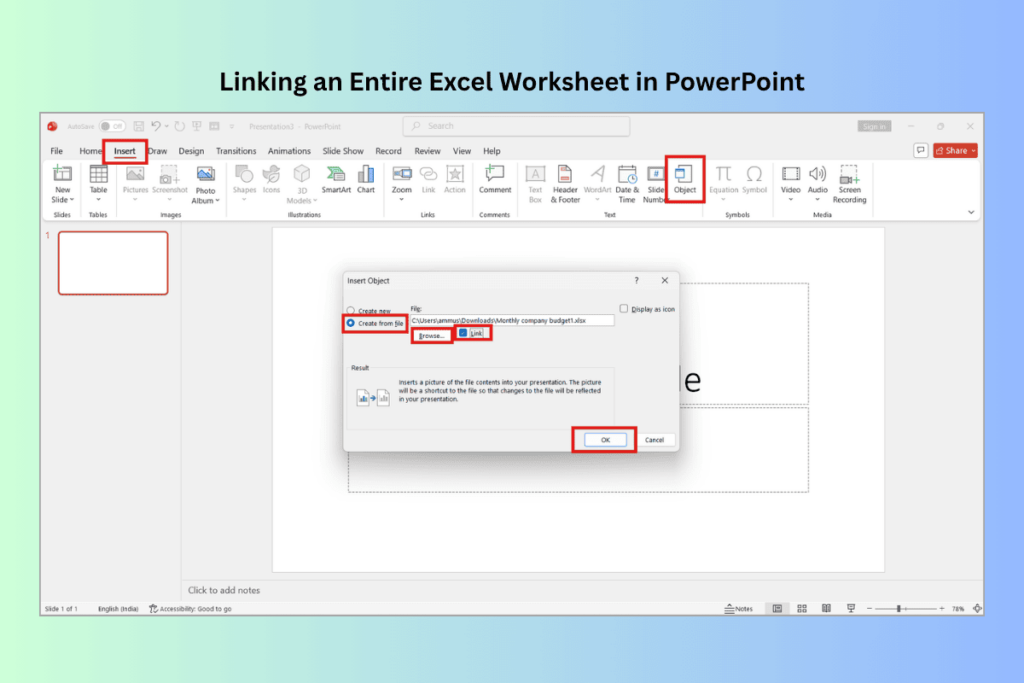
In PowerPoint, go to Insert > Object. Choose Create from file, click Browse, and select your Excel workbook. Tick Link, then click OK.
One thing to know: a linked object shows the top worksheet that appears when the workbook first opens. So before you save Excel, leave the sheet you want on screen.
How to Update a Linked Chart
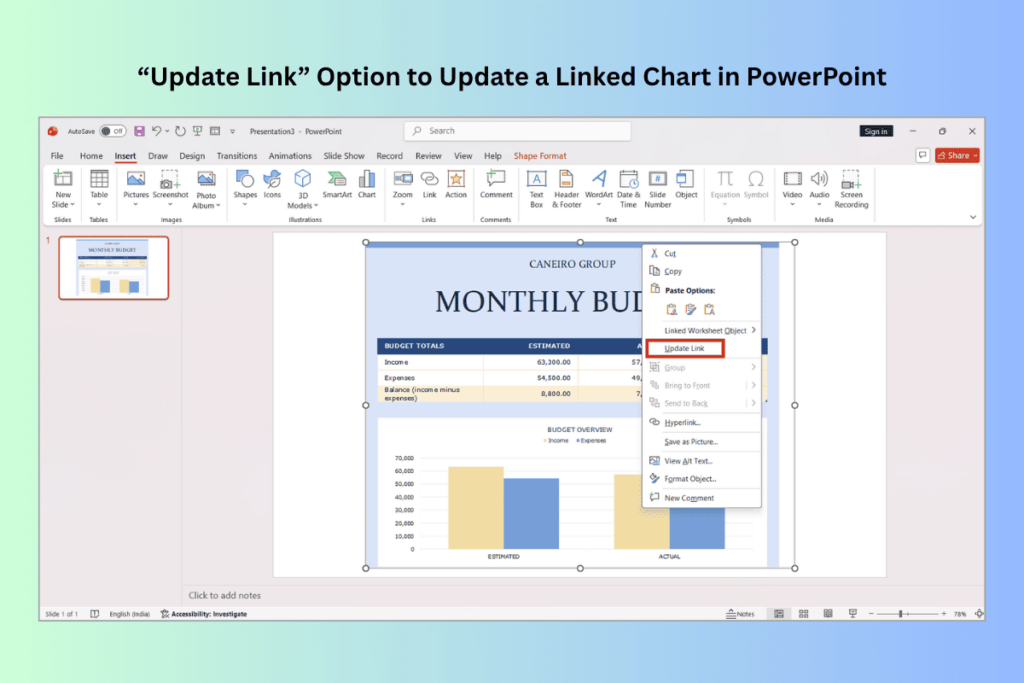
When your Excel data changes, a linked chart can refresh. Right-click the chart in PowerPoint and choose Update Link, or let PowerPoint refresh links when you reopen the file.
This only works while the Excel file stays in the same place. If you move or rename it, the link breaks—so keep linked files together, or embed instead.
How to Keep the File Size Down After Embedding
Embedding a chart also embeds its workbook, so a large or multi-sheet file can bloat your deck—and quietly ship hidden data with it. Two ways to keep things lean:
Before you copy, trim the workbook to just the sheet and range behind the chart, then paste. Or, once the chart is final and won’t change, paste it as a picture instead—it’s the smallest option and carries no underlying data. To slim an existing deck, use File > Compress Pictures and remove any charts you no longer need.
What Are the Common Mistakes to Avoid?
Most chart problems come from picking the wrong paste option or moving files around. Here’s what to watch for.
| Mistake | Fix |
|---|---|
| Pasting as a picture, then needing edits | Use Embed or Link if the data might change; pictures can’t be edited. |
| Linking, then moving or renaming the Excel file | Keep the file in place, or embed the chart so it doesn’t rely on a link. |
| Embedding a huge workbook | It can bloat the deck and expose hidden data. Paste as a picture or trim the file first. |
| Forgetting to refresh a linked chart | Right-click the chart and choose Update Link, or update links on opening. |
| Chart colors clashing with your slides | Use a “Destination Theme” paste option so the chart matches your deck. |
| Trying it in PowerPoint for the web | The chart paste tools need desktop Office. Open in the desktop app first. |
How to Make the Chart Fit Your Slide
A pasted chart rarely lands perfectly. Resize it to leave breathing room, match its fonts and colors to your deck, and give the slide a short, clear title that states the takeaway.
If the surrounding slide still looks plain, a consistent design does more than tweaking one chart. You can build data slides on professionally designed PowerPoint templates so your charts sit in a layout that already looks finished.
Need the chart itself to look better first? Our guides on how to make a chart in PowerPoint and how to choose the best chart for your data pair well with this one. You can also browse more PowerPoint tutorials for related how-tos.
Frequently Asked Questions
How do I insert an Excel chart into PowerPoint?
In Excel, click the chart and press Ctrl+C. In PowerPoint, click the slide and press Ctrl+V. Then click the Paste Options button next to the chart and choose how to paste it—embed the workbook, link the data, or paste it as a picture. Embedding is the default.
What is the difference between embedding and linking an Excel chart?
Embedding stores a copy of the chart’s data inside the PowerPoint file, so it’s self-contained but larger and updates manually. Linking keeps the chart connected to the Excel file, so it stays smaller and refreshes when the source changes—but the link breaks if the Excel file is moved or renamed.
Will my Excel chart update automatically in PowerPoint?
Only if you pasted it with a Link Data option. A linked chart refreshes when the source Excel file changes. Charts pasted as embedded workbooks or as pictures do not update automatically—you’d need to edit or replace them by hand.
How do I update a linked Excel chart in PowerPoint?
Right-click the chart and choose Update Link, or let PowerPoint refresh links when you open the file. For this to work, the original Excel file must still be in the same location—if it was moved or renamed, the link breaks and won’t update.
Can I edit an Excel chart after pasting it into PowerPoint?
Yes, if you embedded or linked it—you can edit the underlying data in Excel and the chart updates. If you paste it as a picture, it becomes a static image that can’t be edited or updated; you can only apply picture styles or replace it.
Can I add an Excel chart to PowerPoint for the web?
The chart copy-and-paste tools need the desktop versions of Excel and PowerPoint; they aren’t available in the web apps. If you’re in PowerPoint for the web, choose Open in Desktop App first, then copy the chart from Excel and paste it into your slide.
Conclusion
Adding an Excel chart to PowerPoint is a copy and paste, not a file conversion. The choice that matters is how you paste it: embed for a shareable file, link for data that keeps changing, or picture for a locked snapshot.
Pick the option that fits how the chart will be used, keep linked files in place, and drop the chart into a clean template so the whole slide looks consistent.