Technology PowerPoint Presentation And Canva Template
 Canva
Canva
Technology PowerPoint, Google Slides, and Canva Template
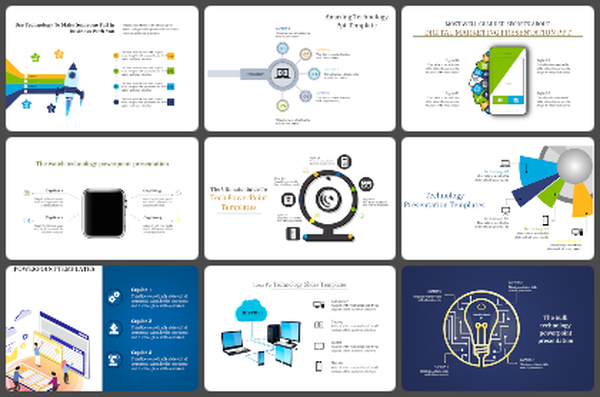
The Technology PowerPoint, Google Slides, and Canva Template is a modern and visually engaging presentation designed to showcase how technology is transforming the way we live and work. Featuring a clean layout with bold blue and red accents, futuristic visuals, and high-quality imagery, this template is perfect for presenting digital transformation, innovation, and emerging technologies in a professional and impactful way.
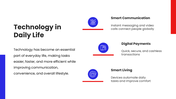
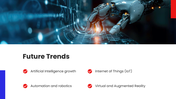
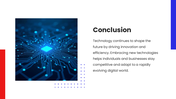
This presentation includes essential topics such as introduction to technology, what is technology, types of technology, importance, technology in daily life, benefits, challenges, future trends, and conclusion. Each slide is thoughtfully structured to simplify complex concepts, helping audiences easily understand the role of technology in business, communication, and everyday life.
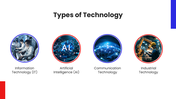
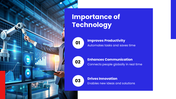
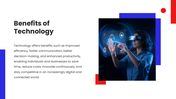
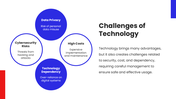
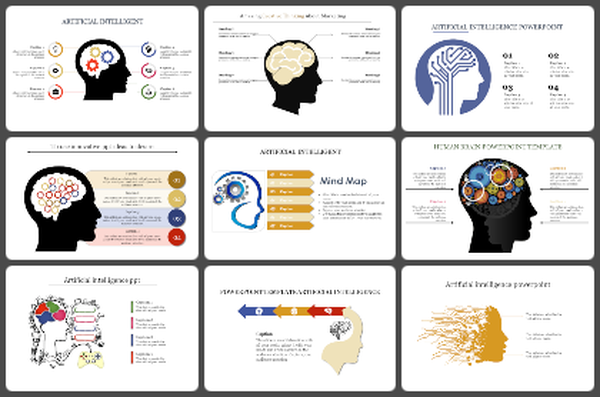
The template highlights key areas like artificial intelligence (AI), information technology (IT), communication technology, automation, smart systems, digital payments, and smart living solutions. It also emphasizes benefits such as improved productivity, enhanced communication, innovation, and efficiency, along with challenges like cybersecurity risks, high costs, and technology dependency.
Fully editable and compatible with PowerPoint, Google Slides, and Canva, this Technology PPT template allows you to customize text, colors, icons, and layouts effortlessly. Ideal for business presentations, tech startups, educators, students, and corporate professionals, this SEO-optimized template helps you deliver clear, insightful, and high-impact presentations on modern technology and future trends.
Features of this template
- 100% customizable slides and easy to download.
- The slides contain 16:9 and 4:3 formats.
- Easy to change the colors quickly.
- Highly compatible with PowerPoint, Google Slides, and Canva templates.

You May Also Like These PowerPoint Templates


