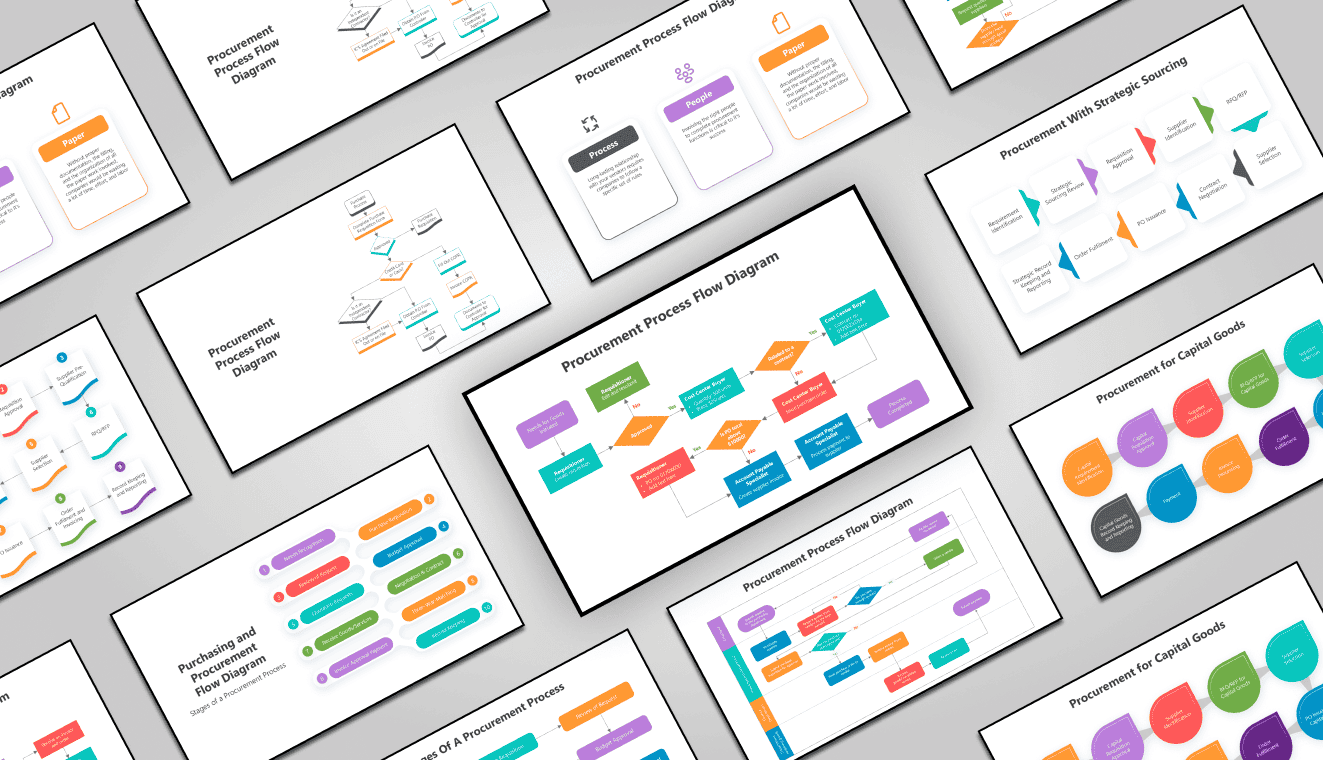
2750+ Free Process Presentation Templates
Browse 2,750+ process presentation templates for PowerPoint, Google Slides, and Canva. All templates are fully customizable and easy to edit. Free and premium options available. Whether you're mapping a business workflow, visualizing an SOP, or building a project process deck, find a professional, ready-to-edit template here.
Editor's Choice (1 of5)


Why Process Templates Work Better Than Blank Slides
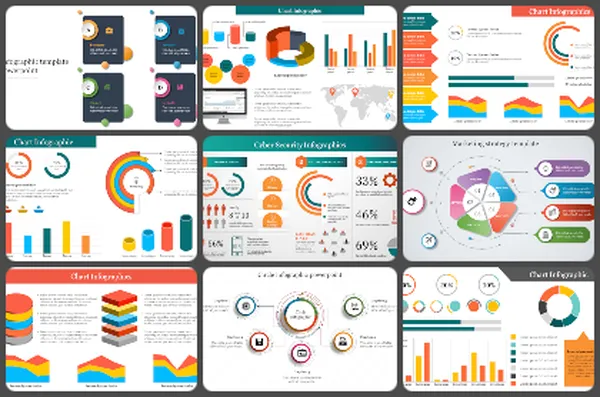
What Types of Process Templates Are in This Collection?
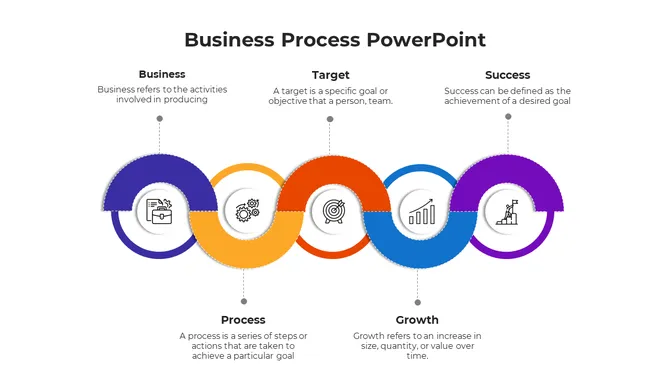
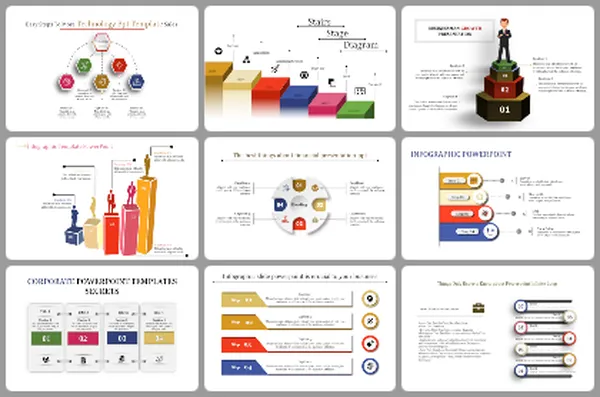
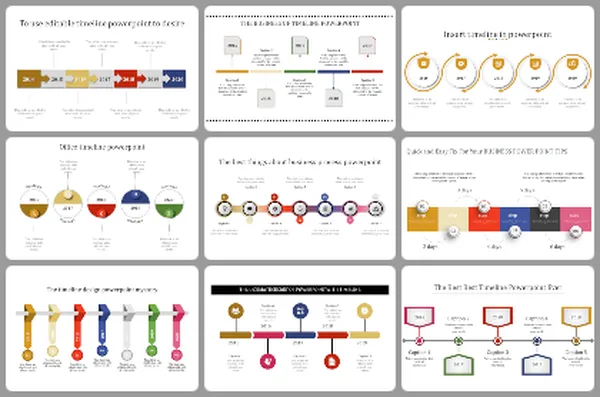
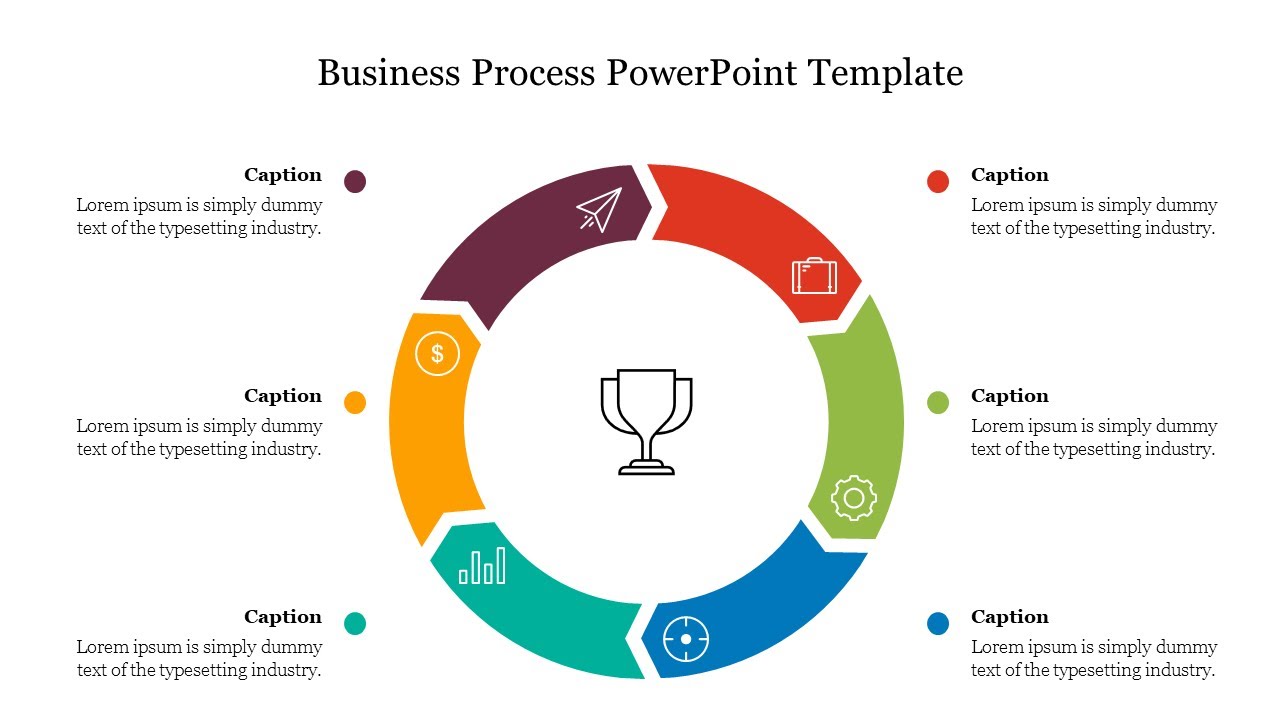
- Business process templates: Map end-to-end workflows across departments, from lead generation to order fulfilment.
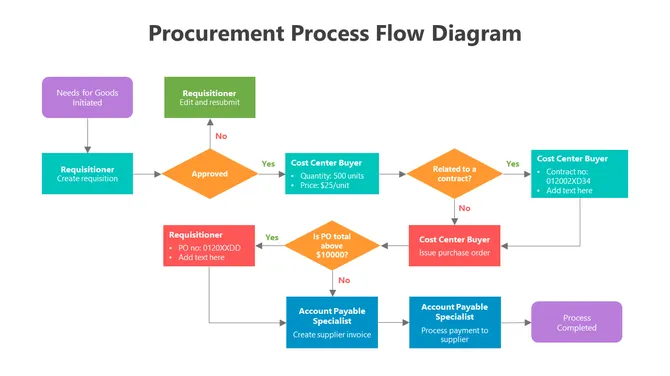
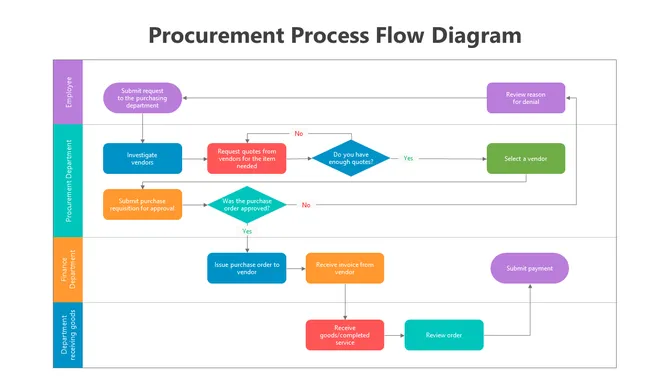
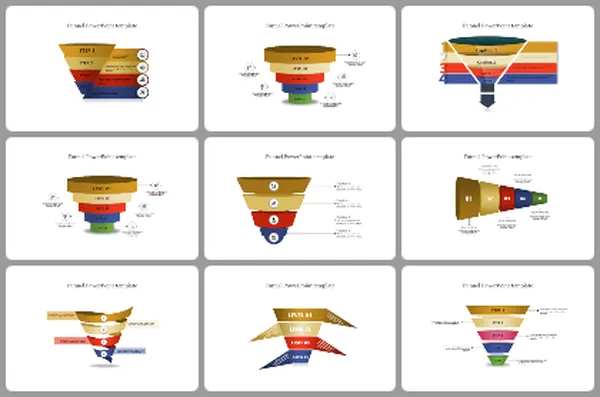
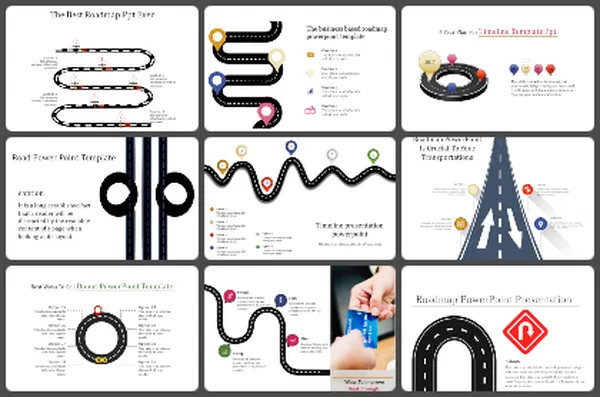
- Process flow diagrams: Show sequential steps with decision points, using arrows, boxes, and swimlane layouts.
- SOP slide templates: Present standard operating procedures in a structured, step-by-step visual format that's easy to train from.
- Process improvement templates: Visualize current-state vs. future-state workflows, highlight bottlenecks, and present optimization plans.
- Onboarding process slides: Walk new employees, clients, or partners through a defined journey from start to success.
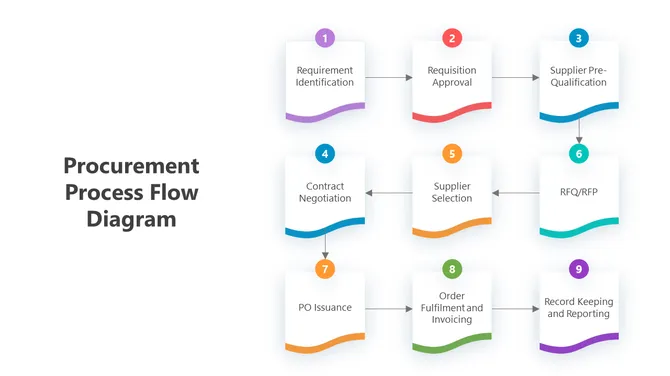
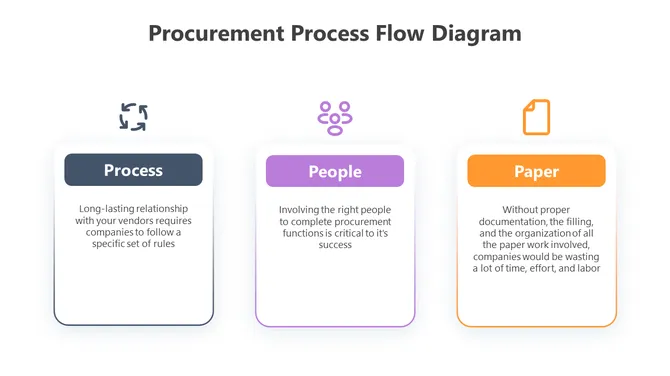
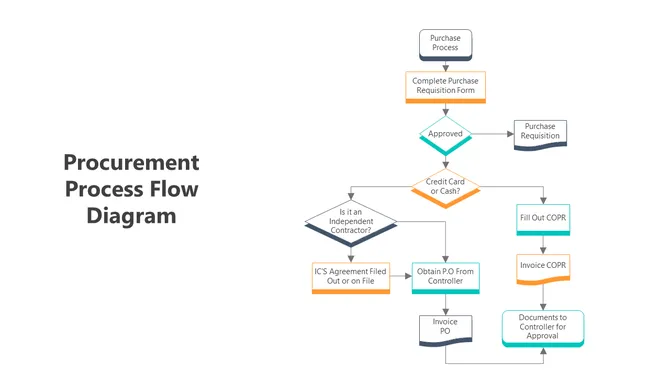
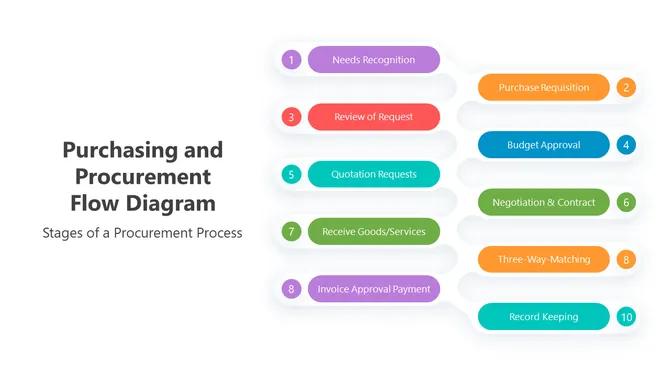
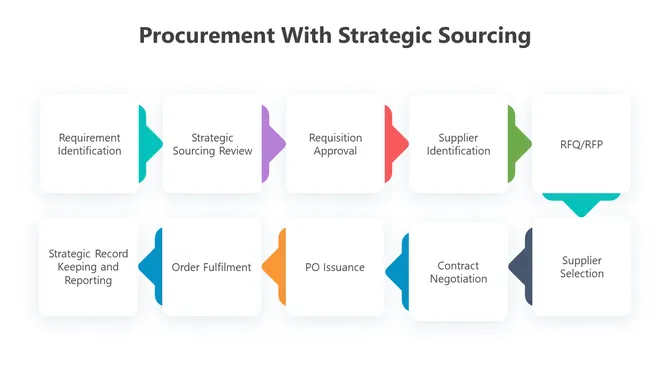
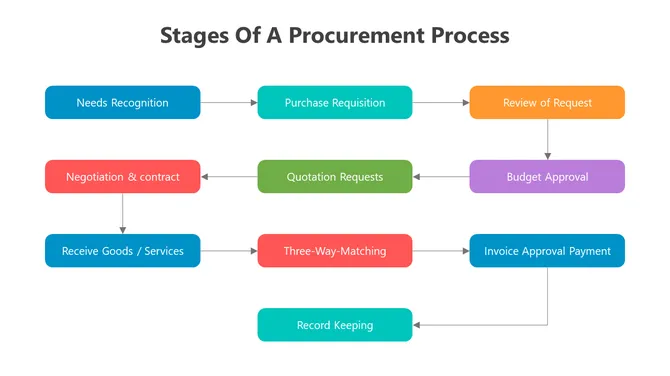
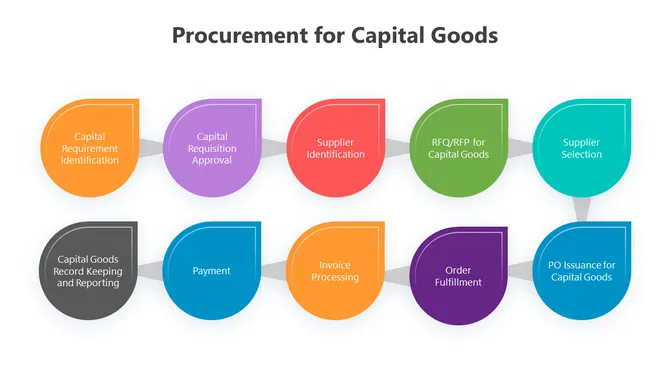
- Procurement and supply chain process slides: Map vendor selection, purchase orders, and approval chains in structured flow diagrams.
- Manufacturing and operations process templates: Show production stages, quality checkpoints, and assembly sequences.
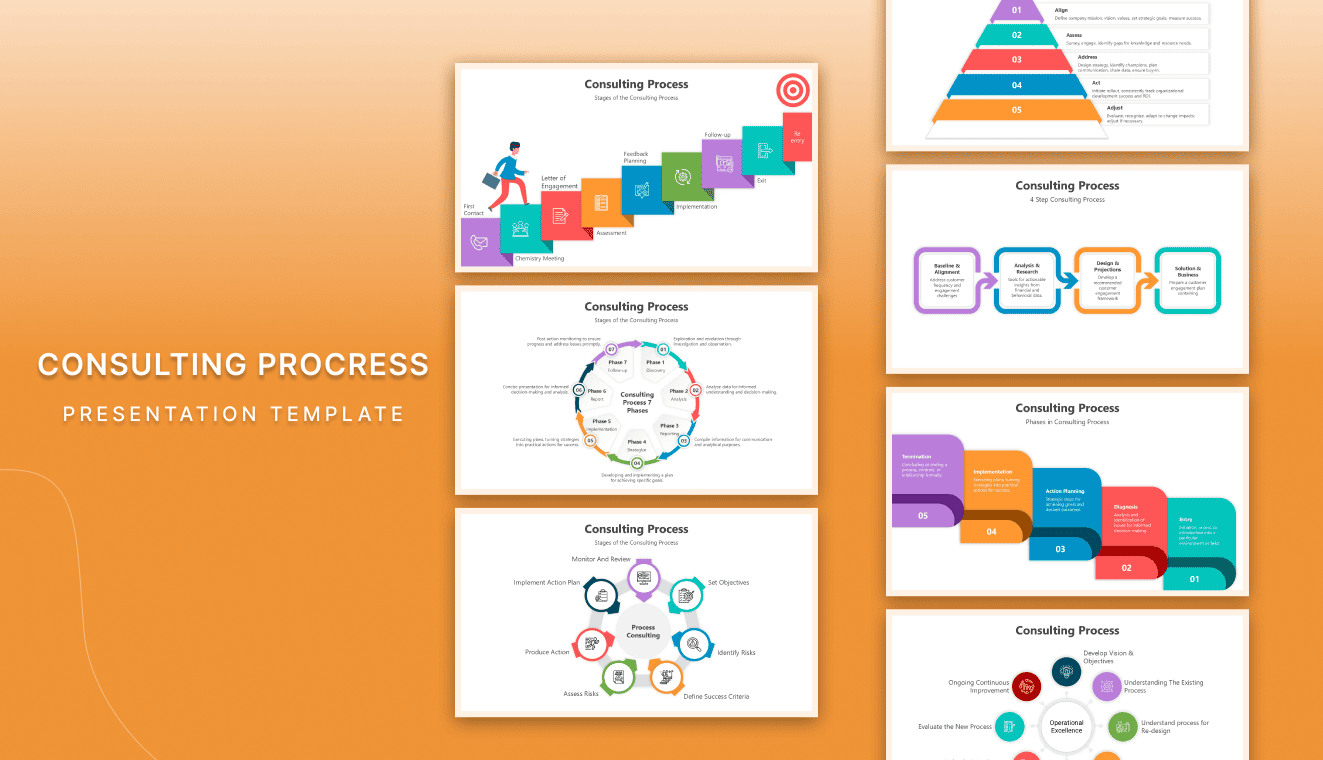
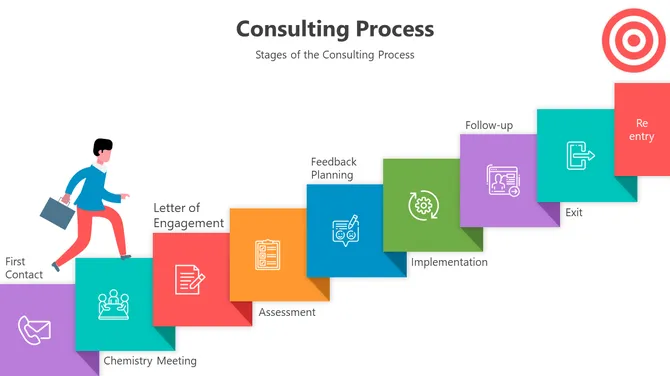
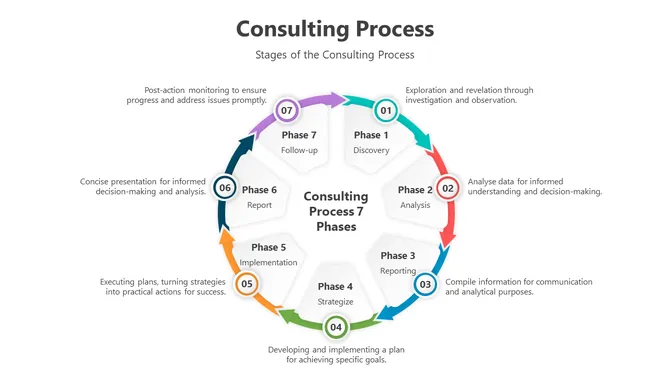
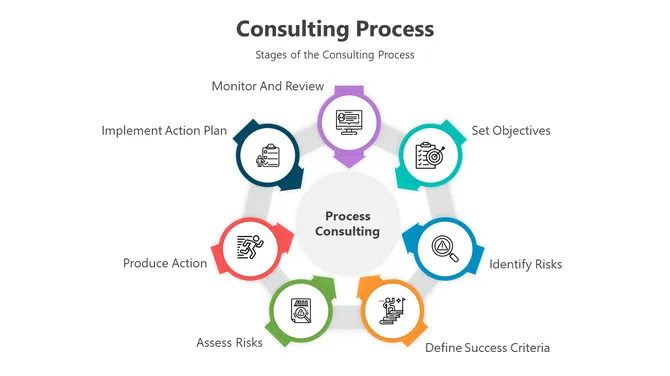
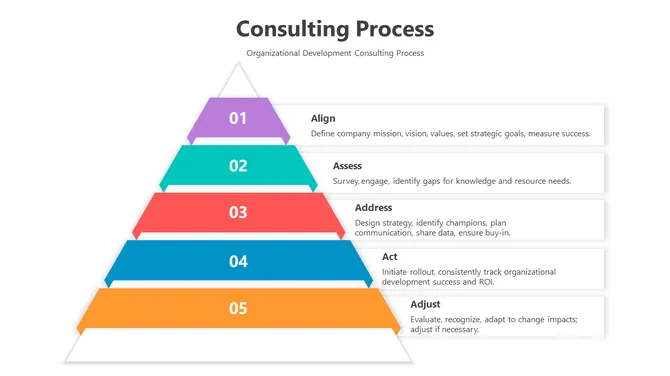
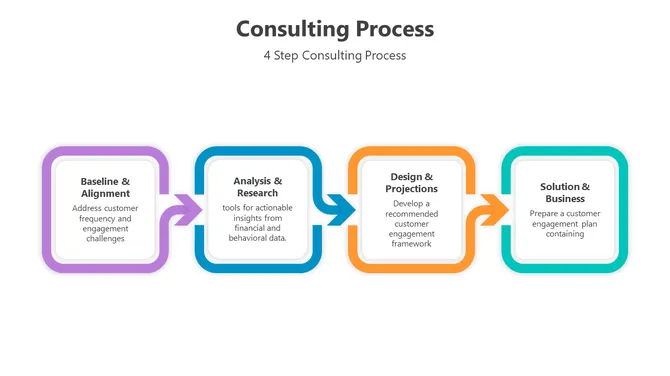
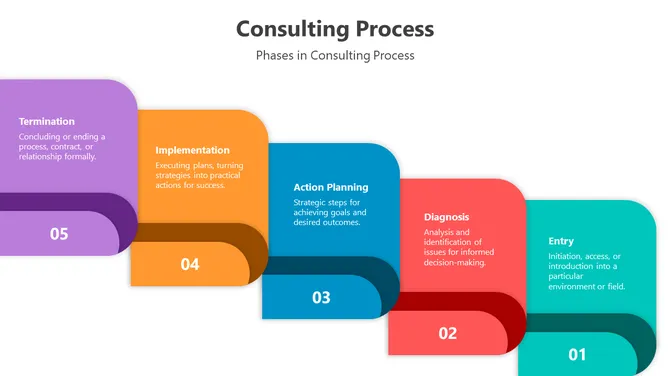
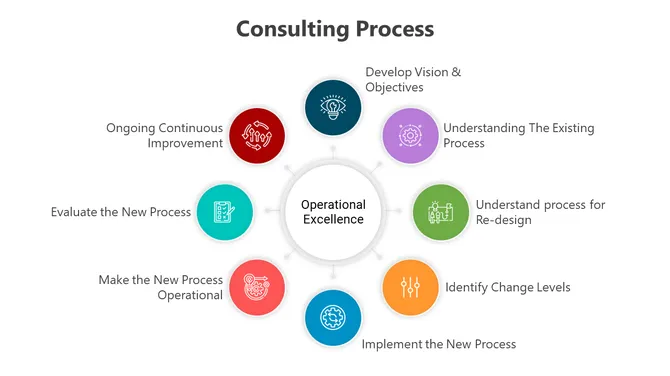
- Consulting process decks: Present discovery, diagnosis, solution design, and delivery frameworks to clients.
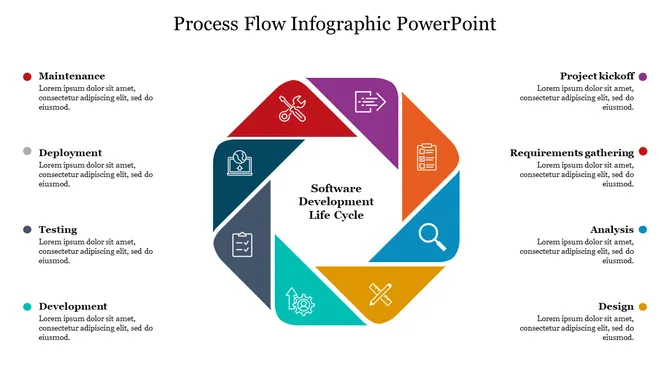
- IT and development process slides: Diagram SDLC stages, sprint workflows, deployment pipelines, and change management flows.
Who Uses These Process Slide Templates?
- Operations managers who need to document and communicate standard procedures
- Project managers building project kick-off decks with milestone and phase breakdowns
- HR teams presenting recruitment processes, performance review cycles, and onboarding journeys
- Consultants and strategy teams mapping client workflows and presenting recommendations
- Sales leaders visualizing sales process stages for team alignment and CRM adoption
- Educators and trainers are turning complex instructional content into visual step-by-step formats
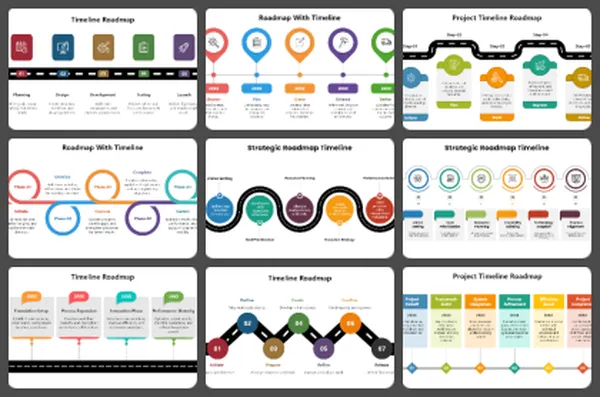
- Executive teams presenting transformation roadmaps and operational change initiatives
How to Choose the Right Process Template
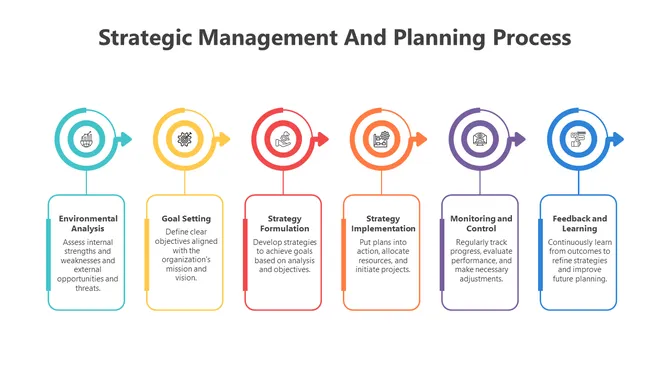
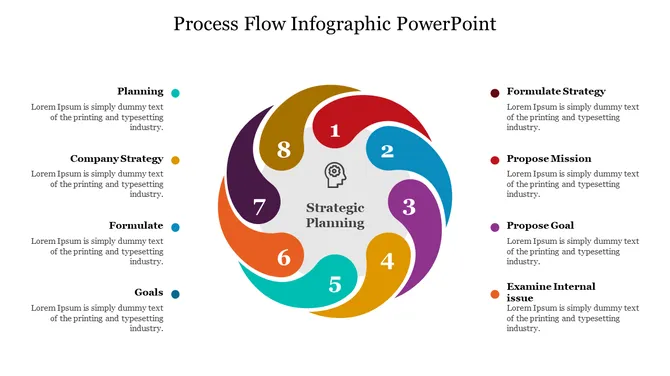
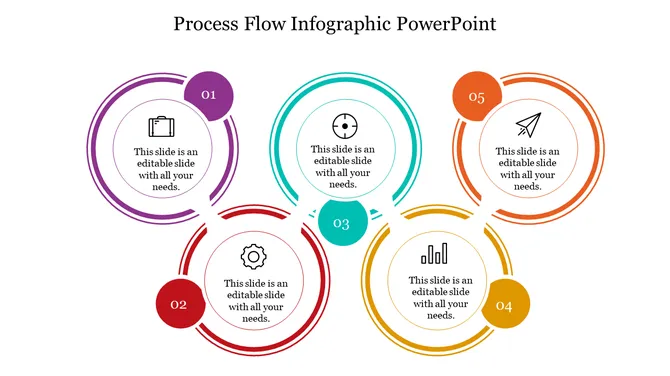
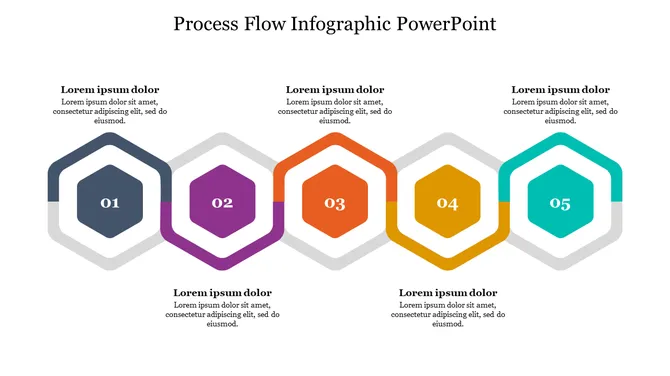
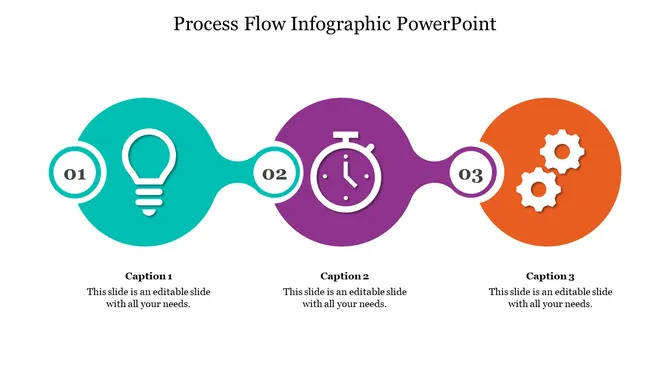
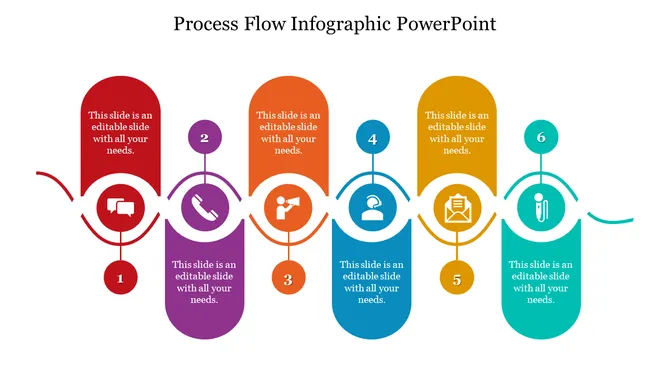
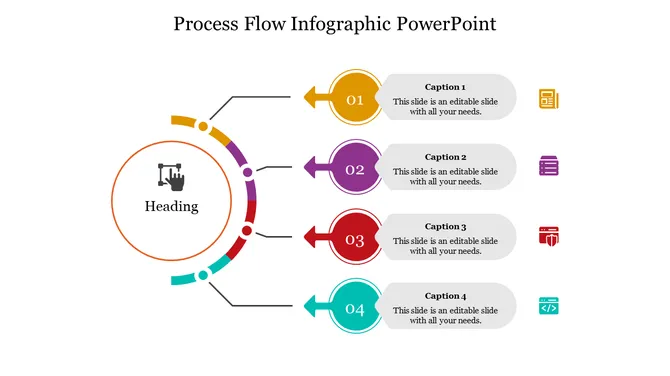
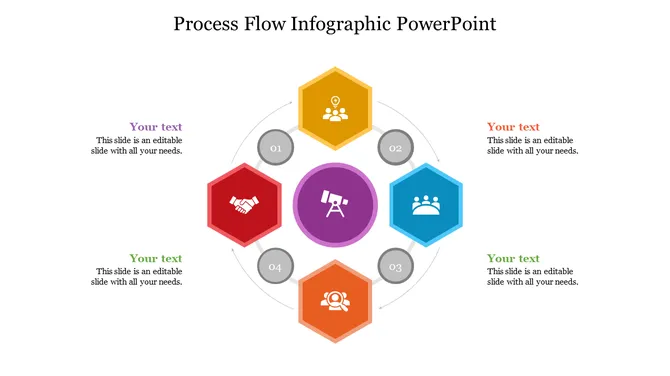
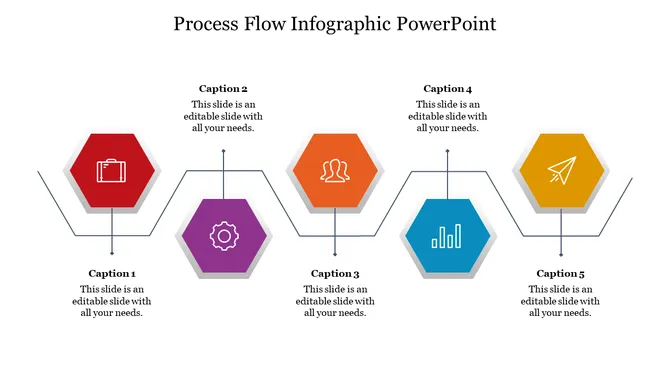
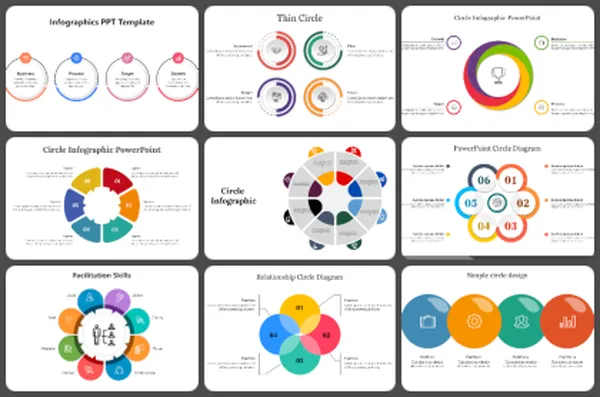
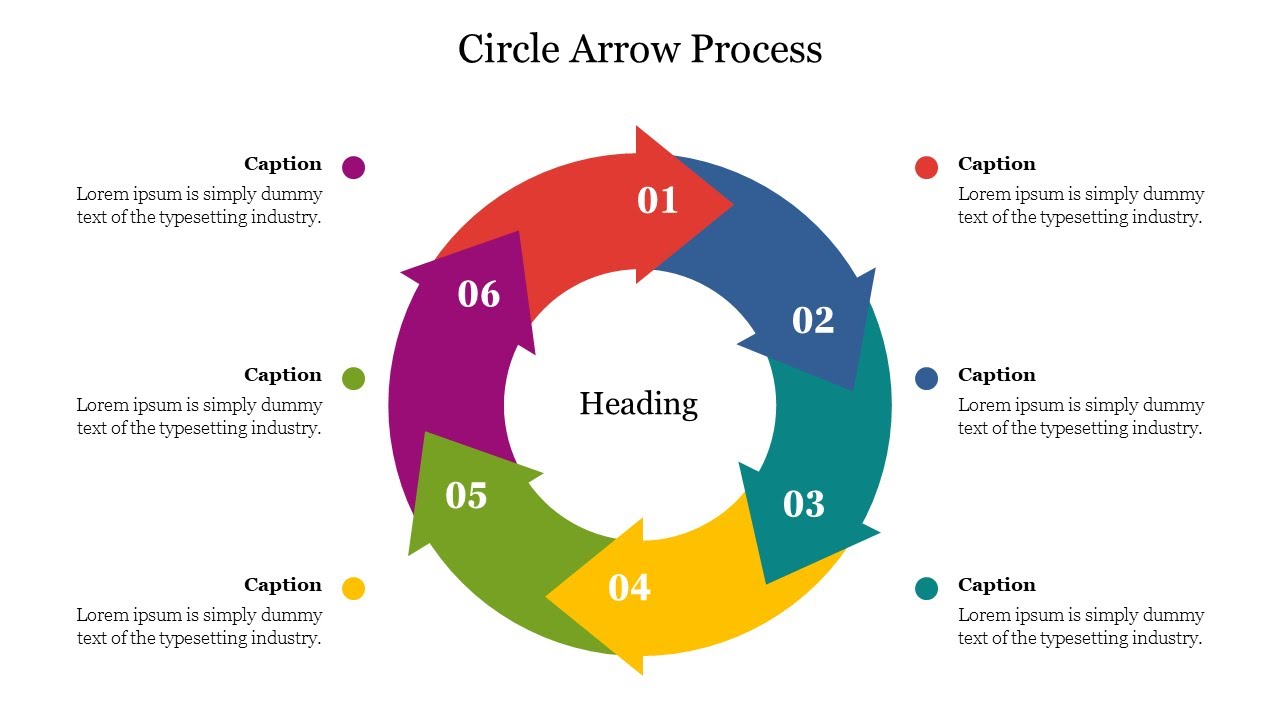
- By Step Count: 3–5 step processes work best with linear arrow flows or circular cycle diagrams. 6–10 step processes suit swimlane layouts or staged chevron designs. Processes with more than 10 steps are best broken into phases — use a phased timeline or modular block design that your audience can scan rather than read all at once.
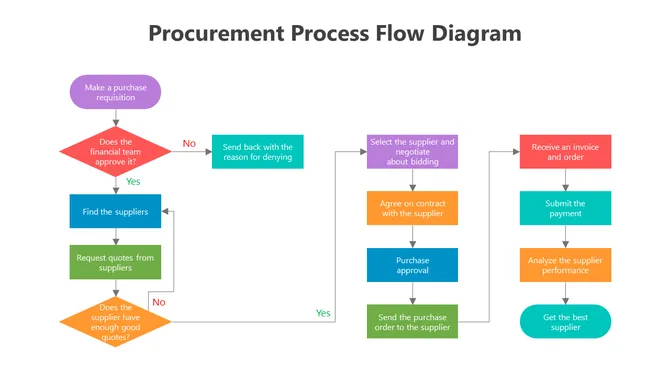
- By Decision Points: If your process includes conditional logic ("if yes, go to step 3; if no, return to step 1"), choose a flowchart template with diamond decision nodes. If your process is purely sequential with no branching, a linear arrow or step-by-step banner layout will be cleaner and faster to read.
- By Audience: For executive audiences, choose templates with high-level phase labels and minimal detail — the story matters more than every micro-step. For operational teams, choose templates with clear action labels, owner fields, and timing columns. For external stakeholders, choose professional, lightly branded designs that look polished without requiring design skills to edit.
Free vs. Premium Process Templates — What's the Difference?
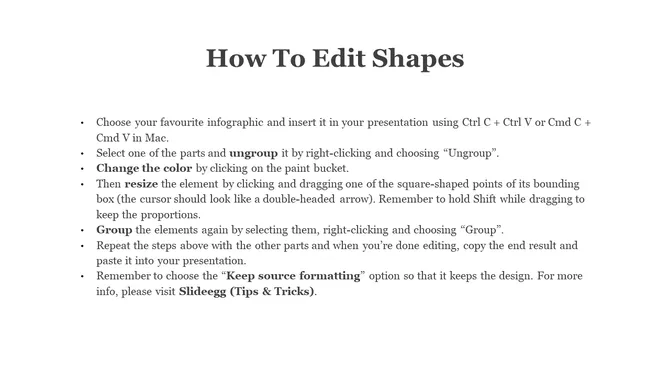
Editing Your Process Template
Formats Available
Related Collections
Become an expert with SlideEgg

Frequently Asked Questions
How do I choose which process to visualize first?
Start with the process that causes the most confusion or problems. Hiring? Customer onboarding? Manufacturing? Pick the one where miscommunication costs you time or errors. Visualize that first. Success there builds momentum for other processes.
What should every process diagram include?
Start point and end point. All major steps in order. Decision points (yes/no branches). Who does what at each step. How long each step takes. Where handoffs happen between people or departments. A clear visual makes these elements obvious.
How do I explain my process to new team members clearly?
Walk them through the visual diagram step by step. Point to each stage. Explain what happens and why. Have them trace the flow themselves. Ask questions to check understanding. Visuals speed up training because people see the whole picture before diving into details.
What's the best way to show process bottlenecks or problems?
Use color coding: green for smooth steps, yellow for slow steps, red for bottlenecks. Or add timing to each step — if it takes too long, flag it. Visual bottlenecks are obvious. Then you can discuss solutions with data, not opinions.
Should I include every tiny detail in my process diagram?
No. Include decision points and major steps. Skip minor tasks that happen within a step. Too much detail creates confusion, not clarity. Your diagram should be readable in 2-3 minutes, not require a manual to understand.
How do I update a process diagram when the workflow changes?
Document what changed and why. Update the diagram. Share it with everyone affected. Make it a habit to review processes quarterly. When processes change but diagrams don't, confusion returns. Keep visuals current.
How do I get buy-in for a new process from my team?
Show them the current process visually. Show them the new process visually. Point out differences. Explain why each change improves things. Let them ask questions. Visuals make the "before and after" obvious, so people understand the reasoning.
Are the process PowerPoint templates free to download?
Yes — hundreds of process templates in this collection are completely free to download. These templates include full PowerPoint (.pptx), Google Slides, and Canva compatibility. Premium multi-slide packs with extended slide counts and advanced designs are available under SlideEgg's paid plans.
Do these templates work with Google Slides and Canva?
Yes. All templates are available for PowerPoint, Google Slides, and Canva. The format options (PPT, Google Slides, Canva) are clearly shown on each template's download page before you download. Simply import the downloaded file into Google Slides via Google Drive, or use the direct Google Slides and Canva link.
Can I edit the colors, fonts, and icons in these templates?
Yes, every template is 100% editable. You can change colors, fonts, icon styles, text, and layout directly in PowerPoint, Google Slides, or Canva without any design software. Most templates also allow you to add or remove steps, resize shapes, and rearrange elements to match your specific workflow.
What is the difference between a process template and a flowchart template?
A process template shows the sequence of steps in a workflow — often with numbered stages, chevrons, or circular diagrams. A flowchart template is a specific sub-type that maps decision points and branching logic using diamond shapes and yes/no pathways. For simple sequential workflows, use a process template. For complex conditional workflows with multiple decision branches, use a flowchart template.
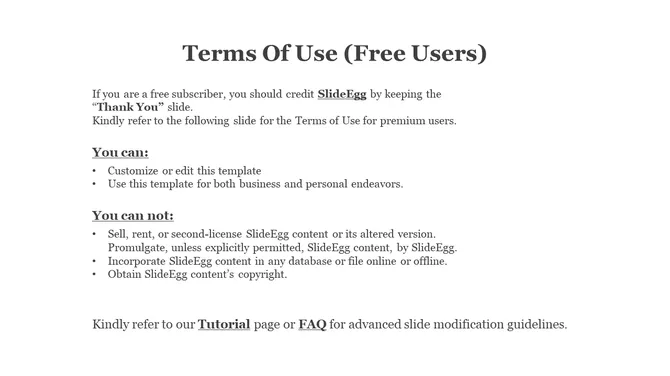
Can I use these templates for commercial presentations?
Yes. All templates — free and premium — are royalty-free for personal and commercial use. You can use them in client presentations, business proposals, training materials, and published reports without attribution. Review SlideEgg's terms of service for full licence details.