Unique Gender Wage Gap Analysis PPT And Google Slides

White circle with orange and blue gender icons, linked to three text boxes with green, red, and orange circular edges.
P.ID : 36023
    10 slides
    Best Gap Analysis PowerPoint Presentation and Google Slides
    13 slides
    Slide deck on gap analysis with colorful infographics, circular diagrams, and segmented categories for business insights.
    16 slides
    A pack of gap analysis overview slides displaying various colorful design layouts with text descriptions.
    624 views
    46 Downloads
    Get Custom Slides by Experts
    Instantly Access Templates in PowerPoint

    Best Gender Wage Gap Analysis PowerPoint Template


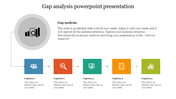
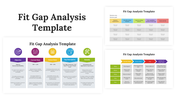
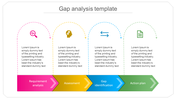
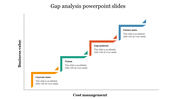
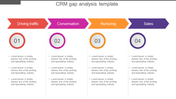
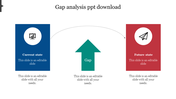
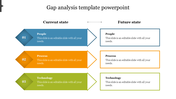
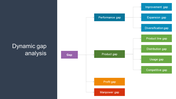
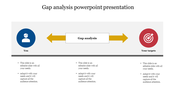
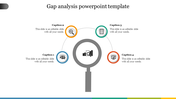
    Delve into the analysis of the Gender Wage Gap an examination of the disparity in earnings between men and women in the workforce. This critical evaluation sheds light on the factors influencing pay inequity, such as job roles, discrimination, and societal norms. Understanding the Gender Wage Gap is essential for fostering equality, promoting diversity, and driving informed decision-making in organizations. Designed for HR professionals, analysts, and advocates of workplace equality, our Gender Wage Gap Analysis template offers a powerful tool for presenting insights and strategies. With fully editable slides, this template simplifies complex data visualization, making it accessible to a wide audience. The template presents a vibrant multicolor theme, providing four customizable options and including diverse shapes for enhanced visual appeal and adaptability. The template features a clean design, ensuring clarity in conveying wage gap findings. Use it to spark discussions, advocate for change, and empower organizations to bridge the gender pay divide. Download now to champion pay equity and prompt actionable initiatives in your presentations.


    Features of this template


    • 100% customizable slides and easy to download.
    • Slides are available in different nodes & colors.
    • The slide contained 16:9 and 4:3 formats.
    • Easy to change the slide colors quickly.
    • It is a well-crafted template with an instant download facility.
    Advertisement

    You May Also Like These PowerPoint Templates

    Add to Wishlist
    Download
    AI Customize
    Five-segment RATER model with colored circles representing service quality factors and placeholder text around each
    Add to Wishlist
    Download
    AI Customize
    A gap analysis process flow slide with five steps each with color coded icons and placeholder text.
    Add to Wishlist
    Download
    AI Customize
    A table with seven rows and five columns showing HR planning gap analysis, with colored headers and checkmarks.
    Add to Wishlist
    Download
    AI Customize
    Basic GAP Analysis PowerPoint Template and Google Slides
    Add to Wishlist
    Download
    AI Customize
    Detailed ISO 9001 gap analysis table, outlining requirements and corrective action processes for nonconformities.
    Free
    Add to Wishlist
    Download
    AI Customize
    CRM Gap Analysis Template PPT Presentation and Google Slides
    Add to Wishlist
    Download
    AI Customize
    White circle with orange and blue gender icons, linked to three text boxes with green, red, and orange circular edges.
    Add to Wishlist
    Download
    AI Customize
    Graph showing skills gap analysis with increasing revenue over time, mapping potential performance and associated risks.
    Add to Wishlist
    Download
    AI Customize
    Matrix chart with four quadrants for market growth and share, labeled A to D in different colors, with arrows on both axes.
    Add to Wishlist
    Download
    AI Customize
    Service gap analysis model with customer perceptions and expectations, connected to service delivery and standards.
    Add to Wishlist
    Download
    AI Customize
    Data analysis slide featuring a table with rows and columns with colored headers and green check marks.
    Add to Wishlist
    Download
    AI Customize
    Gap analysis slide in banking represented by a five point diagram with icons covering the financial sector to transparency.
    Add to Wishlist
    Download
    AI Customize
    Orange circular design linked to five colored text sections in blue, yellow, green, red, and purple on the right.
    Add to Wishlist
    Download
    AI Customize
    Flowchart for gap analysis linking service perception to quality, customer satisfaction, and loyalty.
    Add to Wishlist
    Download
    AI Customize
    Gap analysis slide with a circular diagram in the center and four horizontal, color coded sections with icons and captions.