Dynamic Executive Dashboard PowerPoint Template Slides

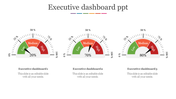
Executive Dashboard PPT
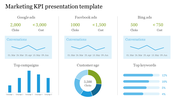
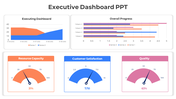
Analyze the key performance metrics at a glance by introducing our comprehensive Executive Dashboard PPT And Google Slide. The slide has four sections. Each of them showcases a bar chart representing crucial aspects. It includes profit, investment and dedication involved in business operations. Captions accompany the charts to provide additional context and insights into the data presented.
Apt for C-suite executives, managers and decision-makers across various industries. Suitable for leading a board meeting, conducting a performance review or presenting to stakeholders. Download now to elevate your executive presentations and streamline your data analysis process.
Features of the template
- The slide contains 16:9 and 4:3 formats.
- Compatible with Google slide themes and PowerPoint.
- 100% customizable slides and easy to download.
- It is easy to change the colors of the slide quickly.
- Well-crafted template with an instant download facility.


You May Also Like These PowerPoint Templates
Add to Wishlist
Download
Edit


Add to Wishlist
Download
Edit


Add to Wishlist
Download
Edit

Add to Wishlist
Download
Edit


Add to Wishlist
Download
Edit

Add to Wishlist
Download
Edit

Add to Wishlist
Download
Edit

Add to Wishlist
Download
Edit


Add to Wishlist
Download
Edit

Add to Wishlist
Download
Edit

Add to Wishlist
Download
Edit

Add to Wishlist
Download
Edit


Add to Wishlist
Download
Edit


